Future South Pars development may include 95/8-in. tubing
A study showed the benefits of installing 95/8-in. tubing strings in future South Pars gas wells in the Persian Gulf. With this large tubing, the study indicates, that a well could produce an optimum 350 MMscfd if the calculations included an erosion constant C of 175.
These high rates imply that a project could obtain a 1 bcfd production rate with only four wells, with one well acting as a spare. With a lower erosion constant of 150, the four wells could still produce 1 bcfd.
The 95/8-in. tubing also would decrease the total wells drilled and completed by a factor of 2 when compared with 7-in. by 5-in. tubing completions because the smaller tubing string would require more wells to attain a 1-bcfd producing rate.
The study used SimSci-Esscor's PIPEPHASE and Aspen Technology Inc.'s HYSYS software for the calculations.
South Pars
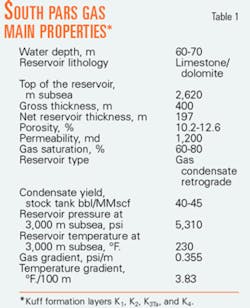
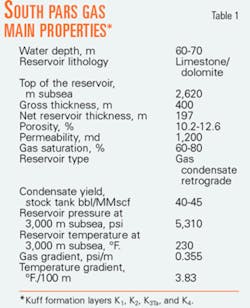
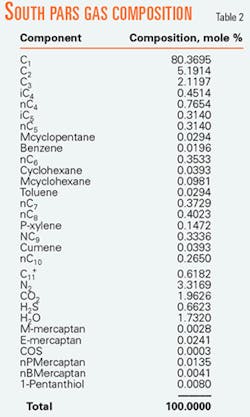
Currently the National Iranian Oil Co. (NIOC) with a number of partners is developing South Pars gas field in the Persian Gulf in several phases. South Pars and North field in Qatar's side of the Persian Gulf form the world's largest known gas accumulation. South Pars covers 3,700 sq km and produces gas from four zones in the Kuff formation that contain about 350 tcf (Tables 1 and 2).
This volume represents about 6% of the world's gas reserves and 50% of Iran's gas reserves. Production from a portion of the first phase began last year.
The current completions have 95/8-in. and 7-in. casing or liners and therefore cannot accommodate 95/8 tubing. But the 95/8-in. production strings should be considered for future wells. Although this would increase the cost of a completion by about 10-15% compared with wells with 7-in. or 7-in. by 5-in. tubing, the field would require fewer wells.
New well string design
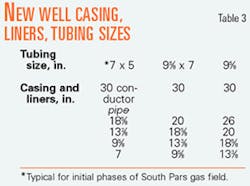
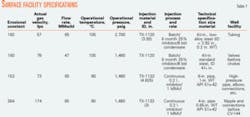
The study investigated the use of 95/8-in. and 95/8-in. by 7-in. tubing strings (Table 3).
Two parameters affecting an optimum production rate are erosional velocity and wellhead flowing pressure. The study obtained erosional velocity from API RP 14E and used PIPEPHASE software (Version 6.2) to calculate pressure loss.
The only meaningful method for evaluating various pressure-gradient prediction methods is to compare predicted pressure gradients with gradients measured in wells.
Lawson10 and Vohra11 presented results obtained from nine correlations used for estimating multiphase pressure drops in vertical pipes. The six correlations compared by Lawson10 are those of Hagedorn and Brown (HB),1 Fancher and Brown.2 Duns and Ros (DR),3 Poettmann and Carpenter,4 Baxendell and Thomas,5 and Orkiszewski (ORK).6
Vohra evaluated three new correlations published by Beggs and Brill,7 Chierici,8 and Aziz.9 All nine methods were tested against a data bank consisting of 726 wells and using identical fluid property routines.
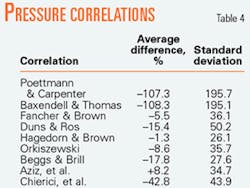
The evaluation computed the mean percent error and standard deviation for the nine correlations. Moreover, each prediction scheme was evaluated within predetermined ranges of five selected variables. These variables were tubing diameter, oil gravity, producing gas-liquid ratio, producing water-oil ratio, and superficial mixture velocity.
Table 4 shows the average percent error and standard deviation for all tests. Based on lowest average percent error, Hagedorn and Brown, Fancher and Brown, and Aziz are the best three. On the basis of lowest standard deviation, Hagedorn and Brown, Beggs and Brill, and Orkiszewski are the three best.
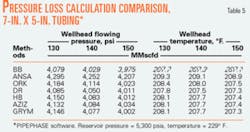
Table 5 compares the methods for determining pressure loss in vertical flow with the PIPEPHASE software for a typical condition in South Pars.
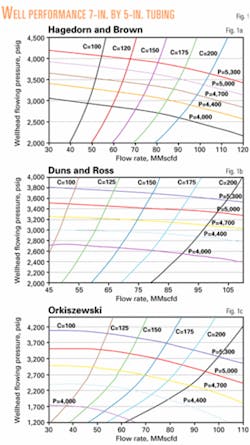
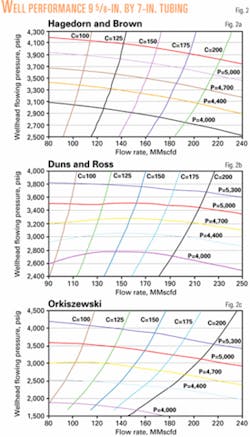
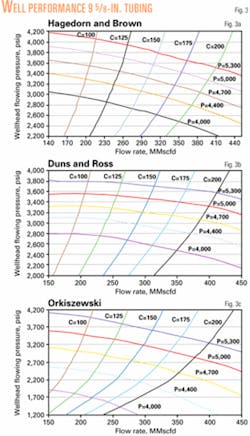
To obtain pressure loss and production rate, the evaluation applied the HB, DR, and ORK methods for simulation the 7-in. by 5-in., 95/8-in. by 7-in., and 95/8-in. tubing size at flowing bottomhole pressures of 5,300 (initial reservoir pressure), 5,000, 4,700, 4,400, and 4,000 psia and different erosional constant C of 100, 125, 150, 175, and 200.
Figs. 1-3 (7-in. x 5-in. tubing size), Figs. 4-6 (95/8-in. x 7-in. tubing size) and Figs. 7-9 (95/8-in. tubing size) show the results of simulation.
Optimum C
At high flow the tubing can experience erosion. This is especially true for high capacity gas wells. The velocity at which erosion begins to occur cannot be determined exactly, and if solid particles such as sand are in the fluid, erosion may occur at relatively low velocities.
The velocity at which erosion may occur has been related to the density of the fluid:
Ve = C/L0.5
Where: Ve=erosional velocity; C= erosional constant; and L=density.
Industry experience to date indicates that, for solids-free fluids, a C of 100 for continuous service and C of 125 for intermittent service are conservative.
For solids-free fluids where corrosion is not anticipated or when corrosion is controlled by inhibition or by employing corrosion resistant alloys, the industry has used C values of 150 to 200 for continuous service and up to 250 for intermittent service.
If solids production is anticipated, the tubing design should use a much lower fluid velocity. Various specific application studies have derived appropriate C values.
The experience in Khangiran gas field, in Iran, also shows that high gas flow rates in Wells 20, 22, 23, 26, and 40 have a reasonable corrosion rate on internal surface of tubing (Tables 7 and 8). In other words, the industrial experience shows that selecting C values based on API RP 14 E is conservative. Therefore, a C of 175 is justified for South Pars.
Optimum tubing size
The study used PIPEPHASE software to determine the optimum production rate for tubing sizes of 7-in. by 5-in., 95/8-in. by 7-in., and 95/8-in. at a specific rate of 1-bcfd gas with C values of 150-175 for South Pars (Table 8).
Table 8 shows that the development needs fewer wells with larger tubing. With a C of 175 the number of wells needed are 11, 6, and 4 for 7-in. by 5-in., 95/8-in. by 7-in., and 95/8-in. tubing, respectively. This calculation assumes one well will be a spare.
Table 9 shows the cost for the drilling and completion string. Note that the total cost for 95/8-in. tubing is $74 million, less than half the $160 million total cost when the wells are completed with 7-in. by 5-in. tubing.
Liquid loading
A liquid phase in gas reservoirs can affect the flowing characteristics of the wells. The liquid can come either from condensation of hydrocarbon gas (condensate) or from the interstitial water in the reservoir matrix.
The gas must transport the liquid phase as droplets to the surface. The flow will usually be in the mist regime where gas is the continuous phase and liquid the discontinuous phase. Liquid loading or accumulation in gas wells occurs when the gas phase does not provide adequate energy for the continuous removal of liquids from the wellbore.
Liquid accumulation imposes an additional backpressure on the formation that can restrict well productivity. In low-pressure wells, the liquid may completely kill the well. In high-pressure wells, slugging will occur that can affect well test results.12
Libson, from field experience, indicates that a minimum velocity of 1,000 fpm is necessary for continuous liquid removal in drop flow.13 Nasria, also from field experience, indicates that if the following relation is satisfied, the well productivity does not decrease as a result of remaining condensate near the wellbore:14
Net reservoir thickness x Permeability > 1,000 md-ft.
South Pars gas reservoir at 3,000 m subsea has a reservoir pressure of 5,310 psia and temperature of 230° F. (Well SP-6). The gas has a 5,185-psia dewpoint pressure and 40-45 bbl/MMscfd condensate-gas ratio (CGR) at standard conditions.
The initial reservoir pressure is about 130 psi greater than its dewpoint pressure. Therefore, as the reservoir pressure is reduced below its dewpoint pressure, liquid will condense from the gas to form a free liquid in the reservoir. This effect causes some condensate to remain in the reservoir. The condensate will normally not flow and cannot be produced.
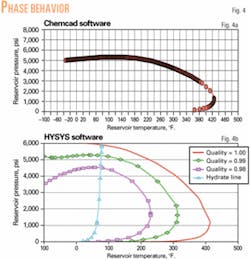
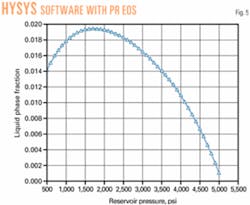
The study used CHEMCAD and HYSYS software with PR EOS to evaluate the phase behavior of South Pars gas field and the remaining liquid volume percent of condensate in reservoir.
Fig. 4 shows that the maximum remaining condensate in the reservoir is 1.9%. Also, if the pressure of reservoir is reduced to lower than 1,800 psi, the fluid properties in the reservoir will be outside of the retrograde region.
The product of net reservoir thickness and permeability for South Pars gas field is 775.5.3.103 md-ft. This value shows that reduction in the production rate of South Pars gas field will not happen as a result of liquid hold up in the reservoir near the wellbore.
On the other hand, the gas velocity through the 95/8-in. tubing is 1,600 fpm, which is 60% more than the limiting value. The minimum value from field experience data for removing condensate is 1,000 fpm.15 The amount of condensate remaining in reservoir, therefore, will be reduced to a minimum level.
The capillary number, Nc, for South Pars is 0.02.3.10-5 and shows that well productivity will not be reduced. Also, the water vaporizing in reservoir will help to remove more condensate from reservoir.
References
1. Hagedorn, A.R., and Brown, K.E., "Experimental study of pressure gradient occurring during continuous two-phase flow in small-diameter vertical conduits," JPT, April 1965, pp. 475-84.
2. Fancher, G.H. Jr., and Brown, K.E., "Prediction of pressure gradients for multiphase flow in tubing," SPE Journal, March 1963, pp. 59-69.
3. Duns, H. Jr., and Ros, N.C.J., "Vertical flow of gas and liquid mixtures in wells," 6th World Petroleum Congress, Frankfurt, June 19-26, 1963.
4. Poettman, F.H., and Carpenter, P.G., "The multiphase flow of gas, oil and water through vertical flow strings with application to the design of gas-lift installations," API Drilling and Production Practices, API, 1952, pp. 257-317.
5. Baxendell, P.B., and Thomas, R., "The calculation of pressure gradients in high-rate flowing wells," JPT, October 1961, pp. 1023-28.
6. Orkiszewski, J., "Predicting two-phase pressure drops in vertical pipes," JPT, June 1967, pp. 829-38.
7. Beggs, H.O., and Brill, J.P., "A study of two-phase flow in inclined pipes," JPT, May 1973, pp. 607-17.
8. Chierici, G.L., Ciucci, G.M., and Sclocchi, G., "Two-phase flow in oil wells, Prediction of pressure drop," JPT, August 1974, pp. 927-38.
9. Aziz, K., Govier, G.W., and Fogarasi, M., "Pressure drop in wells producing oil and gas," Journal of Canadian Petroleum Technology, July-September 1972, pp. 38-48.
10. Lawson, J.D., and Brill, J.P., "A statistical evaluation of methods used to predict pressure losses for multiphase flow in vertical oil well tubing," Paper No. SPE 4267, 48th Annual SPE Fall Meeting, Las Vegas, Nev., Sept. 30-Oct. 3, 1973.
11. Vohra, I.R., Robinson, J.R., and Brill, J.P., "Evaluation of three new methods for predicting pressure losses in vertical oil well tubing," Paper No. SPE 4689, 48th Annual SPE Fall Meeting, Las Vegas, Nev., Sept. 30-Oct. 3, 1973.
12. Robert Mott, "Calculating Well Productivity in Gas Condensate Reservoirs," IBC Technical Services Conference on Optimization of Gas Fields, Aberdeen, June 28-27, 1997.
13. Libson, T.N., and Henry, J.R., "Gas Histories: Identification of and Remedial Action for Liquid Loading in Gas Wells— Intermediate Shelf Gas Play," JPT, April 1980, p. 85.
14. Nasria, MS Thesis, University of Calgary, 2002.
15. Hutlas, E.J., and Granberry, W.R., "A Practical Approach to Removing Gas Well Liquids." JPT, August 1984, p. 519.
The author
Feridun Esmaeilzadeh ([email protected]) is an assistant professor at Shiraz University, Shiraz, Iran. He previous was an engineer with the National Iranian Oil Co. Esmaeilzadeh has a BS in chemical engineering from Abadan Institute of Technology, an MS in chemical engineering from Shiraz University, and a PhD in chemical engineering from Sharif University of Technology.
CORRECTION
The cumulative volume of sulfur recovered from Tengiz oil field production operations in Kazakhstan was reported incorrectly as nearly 5 tons (OGJ Aug. 23, 2004, p. 45). The correct amount is nearly 5 million tons.
