Markets returning to normal; petchem demand running strong
About this series ... This article begins a regular quarterly series, updating developments in the US propane industry.
In second-quarter 2004 North American propane markets and gas processing extraction rates returned to their 5-year averages, indicating that supply is effectively back to normal. Petrochemical consumption ran above normal, however, as it has since the first of the year and, in effect, prevented a normal stock build.
If this situation continues, there will be serious consequences for the 2004-05 winter heating season.
This article analyzes sector by sector through supply, demand, and inventories what the US second-quarter situation 2004 was and forecasts trends for the following 6 months and factors that could alter those trends.
North American markets
Average US propane prices for second-quarter 2004 were only moderately below winter's first-quarter prices at 65.2¢/gal and 62.5¢/gal at Mont Belvieu, Tex., and Conway, Kan., respectively. Stocks were on track to close at 43.5-44 million bbl, or 6-7 million bbl below average because of strong petrochemical demand of 370,000 b/d. Extraction rates continued at average levels of 524,000 b/d.
Third-quarter 2004 natural gas bid week prices will average about $6/MMbtu on the Texas Gulf Coast. Refinery production of propane in second-quarter 2004 was stronger than first quarter at 358,000 b/d.
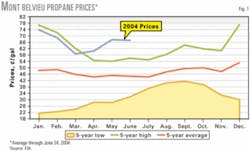
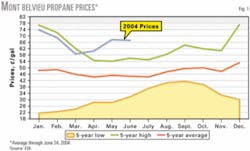
Prices in June were essentially unchanged from May levels, i.e., still averaging 67.2¢ and 64.3¢/gal at Mont Belvieu and Conway, respectively. This pushed second-quarter averages to perhaps the highest ever at slightly more than 65¢/gal at Mont Belvieu (Fig. 1). It also indicates a minor disconnect from crude oil prices which in mid-July had dropped approximately 10% from the highs established in May. Some additional softening may occur, with the turnover of political power in Iraq, but the real world has not changed because of this symbolic gesture.
US demand will strengthen from second-quarter levels as Indian and Chinese economies continue to grow at unsustainable rates. Japan's economy, also growing again, will be another major factor in keeping excess supplies of crude oil out of the market.
Thus, there would appear to be no major softening in either crude oil or propane prices in the near term. Additionally, the fear and speculation driving natural gas prices also put a floor under propane prices. As a consequence, propane prices will likely average no lower than 64-65¢/gal this summer with some possible dips below that level.
On a mid-term basis, prices seem likely to move to the high 60s to low 70s ¢/gal by early fourth-quarter 2004. Longer term, i.e., late in fourth-quarter 2004 and first-quarter 2005, strong winter demand could push prices to 75¢/gal or higher.
Very strong natural gas prices (higher than $7/MMbtu) will be the major force supporting these higher winter prices. As a result, propane price ratios to WTI will run well ahead of historical ratios, pushing above 80% until first-quarter 2005. This is because some softening in crude prices, perhaps to the $35/bbl area, could occur before winter space heating demand sets in.
That softening will be short-lived, however, since much stronger prices appear likely heading into next year's North American motor-gasoline season which begins in April-May of 2005. Record crude oil prices in spring 2005 are still possible. The propane-to-No. 2-fuel-oil ratio increased to 1.15:1, on a ¢/btu basis. The June average WTI ratio rose modestly to 73.2% (spot C3 cash prices vs. cash crude).
With a throughput capacity of 2.4 bcfd, ConocoPhillips' Empress plant in eastern Alberta is one of the largest natural gas processing facilities in North America. Photograph from ConocoPhillips.
Propane supply
US gas processing plants extracted an average 524,000 b/d in second-quarter 2004, according to the US Energy Information Administration. This should mark 6 straight months that extraction rates were at or above the 5-year average and solidifies the conclusion that the shift in processing contracts has increased supplies.
The switch to fee-based contracts in lean-gas regions and partial switch in medium-rich-gas regions have blunted the impact of volatile and escalating natural gas prices on gas processors. Cash margins on both the Texas Gulf Coast and in the Midcontinent, calculated conventionally, were negative in June and will continue so for the remainder of the year, but extraction rates should remain at or above the 5-year average.
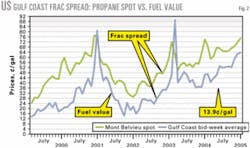
This is expected, despite natural gas bid-week average prices well above $6/MMbtu for the next several months. Fig. 2 shows the positive frac spreads.
Rich gas regions, such as the US Permian basin, are essentially unaffected by gas prices. The outlook for natural gas prices has become more bullish because of a strengthening US economy and because of the possibility of a normal-to-colder-than-normal 2004-05 winter.
Prices in the US could easily reach $7.50-8.00/MMbtu this winter. The latest natural gas build of 93 bcf left working gas in storage at 1.938 tcf or 11 bcf above a 5-year average, as of June 25, 2004. Refinery production improved in the second quarter to 361,000 b/d, while imports, both waterborne and Canadian, fell dramatically to 152,000 b/d.
Marine propane imports
US waterborne imports in June were 2.5 million bbl, with 75% scheduled for the US gulf.2 If all of these cargoes made, it will significantly help US stocks, particularly the East Coast, which also has been well below normal.
At least 1.6 million bbl were scheduled for early July (full data were unavailable at press time), all of which were headed for the US gulf. Spot-price netbacks for the western Mediterranean Sea were positive into both the US East Coast and US gulf, but cargoes from the North Sea were just at breakeven into the US East Coast and negative into the US gulf by $4/tonne.2
In contrast, US waterborne exports during the late second quarter and early third quarter continued to be insignificant, at less than 10,000 b/d. Total exports, including those to Canada and Mexico overland averaged about 25-30,000 b/d
Petrochemical demand
The ethylene industry should have a strong third quarter with operating rates running greater than 87% of nameplate capacity. It is indicative of the success of the industry in passing along strong raw material prices and fuel costs to consumers, since both of these have remained very high during the past 6 months. It obviously applies almost exclusively to US markets, however, since the US petrochemical industry is only marginally competitive in world markets because of these factors.
Feedstock consumption totaled more than 1.75 million b/d during second-quarter 2004 with propane accounting for more than 20%. This was surprising, since propane, with a cash cost of more than 25¢/lb of ethylene produced, was not competitive with ethane, ethane/propane mix, natural gasoline/light naphthas, and raffinate. If it were not for the coproduct propylene produced, US propane consumption would have been significantly lower than it has been.
The US economy is growing at a sustainable pace that should support growing operating rates, but the fact that the US dollar stopped declining during the second quarter will hurt US exports of petrochemicals and derivatives.
The declining dollar partially offset in late 2003 and early 2004 high domestic fuel and feedstock costs. Propane demand in 2004 is forecast at 338,000 b/d.
Propane inventories
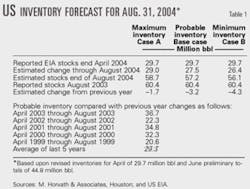
Although final data were not entirely available at press time, propane stocks will likely have ended the second quarter at 43.5-44.5 million bbl, which puts them 6-7 million bbl below normal (normal = 5-year average). Table 1 presents a forecast of stocks. This shortfall occurred even though waterborne and Canadian imports accelerated to 150-200,000 b/d through June and early July.
Strong and steady petrochemical demand, which has run above average since the beginning of 2004, has been the major factor preventing a more normal build thus far in 2004. While some moderation in petrochemical (ethylene) demand will occur, the decline will not be enough to allow stocks to reach average levels (62 million bbl) by the end of the build season in late September.
Regional inventories
US East Coast stocks hit a new 5-year low in April, but with stronger waterborne imports through the summer, inventories should peak near 5.5 million bbl in November.
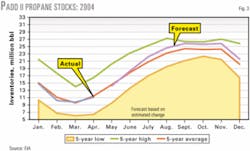
US Midcontinent stocks will likely have closed the second quarter at 18.3 million bbl, right on the region's 5-year average. Based on continued solid extraction levels from gas processing plants and above-average Canadian imports, the region's stocks will track above normal for the last 6 months of the year, peaking at 25-26 million bbl (Fig. 3) in late September.
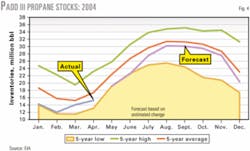
Gulf Coast second-quarter stocks barely reached 22.5 million bbl and remained at new 5-year lows. Despite substantial imports in June and early July, it is now highly likely that the region will track below normal for the remainder of the year because of strong petrochemical consumption.
Stocks will likely peak at 30 million bbl by late third quarter or early fourth-quarter 2004 (Fig. 4).
Canadian inventories
Canada's National Energy Board reported that stocks grew only 475,000 bbl in May,3 but this is far below the normal 1.7 million bbl added to inventory.
Based upon current natural gas prices, no reason exists why extraction rates should not proceed at normal levels, thus fostering a normal propane build season. The peak will likely be nearer 10 million bbl rather than higher, given that exports to the US Midcontinent continue strong because of US prices.
The West-East split moved to 40:60 because of strong eastward flow.
References
1. US Energy Information Administration, Petroleum Supply Monthly, April 2004.
2. Estimated by Commercial Services' Waterborne LPG Report, June 24, 2004.
3. National Energy Board LPG Underground Inventories in Canada, June 10, 2004.
The author
Michael Horvath Jr. (mhorvath@propane-letter. com) is president of M. Horvath & Associates, Houston, and author of The Propane Market Strategy Letter. He served as director of business development at Tauber Oil Co. until retiring earlier this year. Horvath has more than 30 years of experience in the NGL, petrochemical, and consulting business. He holds a BS (1972) in chemistry and mathematics from the University of Houston and has taken postgraduate courses in business law and economics. Horvath is a member and past chairman of the Houston Chapter of the Gas Processors Association and the Gas Processors Suppliers Association.
US Petroleum Administration for Defense Districts—PADDs
PAD District I (East Coast):
- Subdistrict IA (New England): Connecticut, Maine, Massachusetts, New Hampshire, Rhode Island, Vermont.
- Subdistrict IB (central Atlantic): Delaware, District of Columbia, Maryland, New Jersey, New York, Pennsylvania.
- Subdistrict IC (lower Atlantic): Florida, Georgia, North Carolina, South Carolina, Virginia, West Virginia.
PAD District II (Midwest): Illinois, Indiana, Iowa, Kansas, Kentucky, Michigan, Minnesota, Missouri, Nebraska, North Dakota, South Dakota, Ohio, Oklahoma, Tennessee, Wisconsin.
PAD District III (Gulf Coast): Alabama, Arkansas, Louisiana, Mississippi, New Mexico, Texas.
PAD District IV (Rocky Mountain): Colorado Idaho, Montana, Utah, Wyoming.
PAD District V (West Coast): Alaska, Arizona, California, Hawaii, Nevada, Oregon, Washington.
Source: US Energy Information Administration (EIA; ttp://www.eia.doe.gov).
