Effects of porosity, permeability in 225 Permian basin reservoirs
The two reservoir properties most commonly used in petroleum geology and engineering studies are porosity and permeability.
Reviews of these two frequently leads to questions such as, "How much do they affect each other?" or "How much did changes in either one effect reserves?" or "How much do changes in either effect other reservoir properties."
Although it is difficult to predict if any relationship between the two exists, a review of porosity and permeability data in an area should lead to a greater understanding of how much they effect each other and other reservoir properties and how important each may be to the amount of reserves present.
Reserve data available from the Texas Bureau of Economic Geology covered 225 reservoirs in the Permian basin. Although this was only a portion of the reservoirs in the area, the sample included a significant amount of data for all large reservoirs and a great deal of data for many of the small reservoirs.
Individual recoverable reserves ranged from 10.1 million bbl to 2 billion bbl with a total recoverable reserve of 19.7 billion bbl. No data on reservoirs with less than 10.1 million bbl reserves were available.
Thirty-six of these reservoirs had recoverable reserves of over 100 million bbl, and 189 had reserves of less than 100 million bbl. Four of the large reservoirs had reserves of over 1 billion bbl. The data reviewed here do not cover all the reservoirs in the basin but include enough to yield a reasonable review.
Reservoir data available included the number of reservoirs present, recoverable reserves, porosity, permeability, depths of production, oil-column thickness, and water saturation. Data for fluid properties included initial pressure, reservoir temperature, API gravity, and gas-oil ratio. Unfortunately, little or no information was available on proved acreage for the small reservoirs, which may be the most basic data point concerning reserves.
The trend of data is shown in addition to the average data for each value graphed. For plotting convenience where data were not available the values were not shown on the graphs.
Number of reservoirs
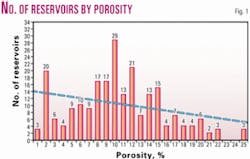
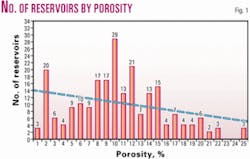
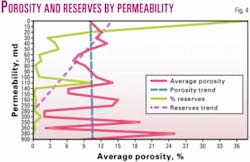
Porosity ranged from 1% to 25% and averaged 10% (Fig. 1). The largest group of reservoirs, 29 or 13% of the total, had porosity of 10%. Data for reservoirs with high porosity were limited in the intervals from 21% to 25%, as two values, 21% and 25% had only two reservoirs, one value of 22% had three reservoirs, and values of 23% and 24% had no data available.
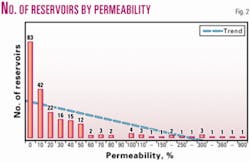
So great was the range in permeability values that it was necessary to plot in intervals of 10 md rather than each individual value (Fig. 2). The intervals such as 0-9 md, 10-19 md, and 20-29 md, for example, were shown as 0, 10, 20, 30, and so on.
Two reservoirs had no permeability values recorded, so data for 223 reservoirs were available. Permeability ranged from 0 to 903 md and averaged 40 md. Eighty-three reservoirs, 37% of the total, had permeability in the 0 to 9 md range.
Data were limited in the higher permeability values as the interval of 160-169 md had two values recorded, 300-309 md had three readings, and eight permeability intervals between 140 and 900 md had one reading each.
Any intervals between 140 and 900 md with no permeability values recorded were not shown on the figures. No permeability values were recorded in the 90-99 md interval, the 120-139 md interval, and the 380-890 md intervals.
Porosity and permeability
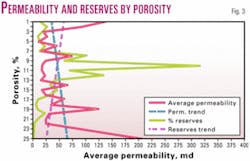
As porosity increased, permeability increased (Figs. 3 and 4).
Average permeability at 1% porosity was 139 md in three reservoirs with a range of 54-300 md. Average permeability at 22% porosity was 23 md in three reservoirs with a range of 6-49 md. There was a final average of 205 md at 25% porosity in two reservoirs with a range of 30-389 md.
Highest permeability recorded was 903 md at a porosity of 8%, and lowest permeability recorded was 0 md at a porosities of 8% and 10%. Widest range of permeability was 0-903 md in 17 reservoirs, 8% of the total, with a porosity of 8%.
As permeability increased, average porosity remained the same. Average porosity at 0-9 md permeability was 10% in 83 reservoirs, 37% of the total, with a porosity range of 2-22%. Average porosity at 380-389 md permeability was 25% in one reservoir falling to 8% at a permeability of 900-909 md in one reservoir.
The widest range of porosity was 2-25% in 16 reservoirs with permeability of 30-39 md.
Effect on reserves
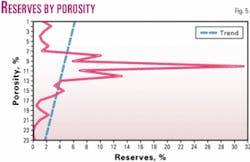
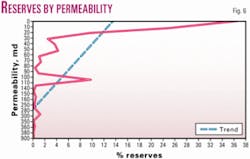
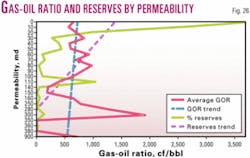
Percent of reserves shown on all graphs illustrates the effect or lack of effect of the various properties on reserves (Figs. 5 and 6).
Average reserve size was 87.8 million bbl with a range from 10.1 million to 2 billion bbl.
Largest reserves, 6.2 billion bbl, 32% of the total, were in 29 reservoirs with porosity of 10%. Smallest reserves were 11.1 million bbl, 0.11% of the total, in one reservoir with 25% porosity.
Largest range of reserves was in 29 reservoirs with 10% porosity with a range from 10.6 million bbl to 2 billion bbl.
Largest reserves, 7.1 billion bbl, 38% of the total, were in 83 reservoirs with permeability of 0-9 md. Smallest reserves were 14.2 million bbl, 0.07% of the total, in one reservoir with permeability of 150-159 md.
Largest range of reserves was in three reservoirs with permeability in the 110-119 md interval with a range from 11.3 million bbl to 2 billion bbl.
The four reservoirs with over 1 billion bbl reserves showed one reservoir with 8% porosity and 10-19 md permeability, one reservoir with 10% porosity and 0-9 md permeability, one reservoir with 10% porosity and 110-119 md permeability, and one reservoir with 12% porosity and 10-19 md permeability.
Reserve sizes
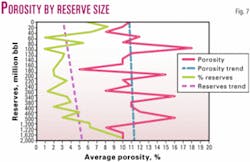
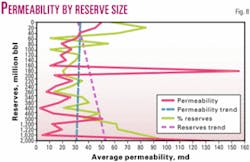
No reserves were present in the size intervals of 170-179 million bbl, 180-189 million bbl, in the seven intervals between 270 million and 339 million bbl, in the four intervals between 420 million and 469 million bbl, and the three intervals between 480 million and 509 million bbl (Figs. 7 and 8).
Only four intervals between 1 billion and 2 billion bbl had reserves.
Highest average porosity was 18% with a range of 15-21% in two reservoirs with 100-109 million bbl reserves. Lowest average porosity was 5% with a range of 1-9%, in two reservoirs with 180-199 million bbl reserves. Largest range of porosity was 24% from 1 to 25%, in 78 reservoirs with 0-19 million bbl of reserves.
Highest average permeability was 155 md in two reservoirs with 180-199 million bbl reserves. Lowest average permeability was 4 md in one reservoir with 1.6 billion bbl reserves. Lowest average permeability in more than one reservoir was 10 md, with a range from 3 to 20 md, in two reservoirs with 160-179 million bbl reserves. Largest range of permeability was from 0 to 903 md in 78 reservoirs with 0-19 million bbl of reserves.
Reservoir depth
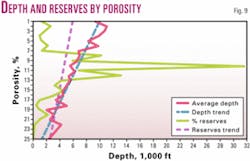
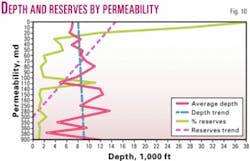
Average reservoir depth was 6,494 ft with a range from 1,250 ft to 13,800 ft (Figs. 9 and 10).
Widest range of depths was at 14% porosity with a depth of 5,000-5,500 ft with a range of depths from 1,500 to 12,600 ft.
The largest number of reservoirs at one porosity value was 29 with porosity of 10% at an average depth of 5,519 ft and a range of depths of 1,250 ft to 8,700 ft. Highest individual porosity was 25% at depth of 1,300 ft. Lowest individual porosity was 1% at a depth of 8,500 ft.
Highest permeability was 903 md in one reservoir at depths of 10,500-11,000 ft.
Lowest permeability of 0 md was at an average depth of 6,158 ft with a range of 1,700 to 12,800 ft. The widest range of depths was 12,100 ft, from 1,300 to 13,300 ft, at permeability of 40-49 md. Largest number of reservoirs was 83 at a permeability of 0-9 md at an average depth of 6,158 ft with a range of 1,700 ft to 12,800 ft.
The four largest reservoirs are at depths of 1,250 ft, 4,900 ft, 5,000 ft, and 6,700 ft.
Parameters by depth
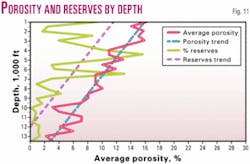
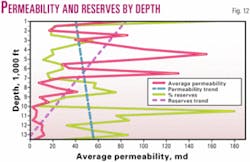
Largest number of reservoirs, 24 or 11% of the total, had an average depth of 4,063 ft with a range of 4,000 ft to 4,400 ft and largest reserves, 15 of the total, were in 19 reservoirs with an average depth of 4,742 ft and a range of 4,500-4,900 ft (Figs. 11 and 12).
Average porosity decreases with an increase in depth. Highest average porosity of 17% was in three reservoirs at an average depth of 1,283 ft with a range of porosity from 10% to 25%. Lowest average porosity of 2% was in six reservoirs at 13,000-13,500 ft.
Widest range of porosity was 3-22% at depths of 4,500-4,900 ft. Largest number of reservoirs were 24 at an a average depth 4,063 ft and an average porosity of 11% with a range of 5-20%.
Average permeability increases with an increase in depth. Highest average permeability was 180 md in six reservoirs at an average depth of 10,600 ft. Lowest average permeability was 11 md in 11 reservoirs at a depth of 5,182 ft.
Widest range of permeability was from 2-903 md at an average depth of 10,600 ft and a range of 10,500 to 11,900 ft. Largest number of reservoirs was 24, 11% of the total, at an average depth of 4,063 ft with an average permeability of 19 md with a range of 1-111 md.
Oil column thickness
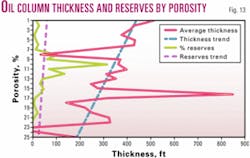
Average thickness was 344 ft with a range of 30-1,400 ft. Largest number of reservoirs had an average thickness of 362 ft and a range in thickness of 47-800 ft.
Highest average oil column thickness was 850 ft in four reservoirs with 16% porosity (Fig. 13). Highest single oil column thickness was 1,400 ft in one reservoir with 16% porosity. Smallest average oil column thickness was 137 ft in four reservoirs at 4,000-4,500 ft.
High porosity of 25% had a thickness of 215 ft, and the low porosity of 1% in three reservoirs had an average thickness of 511 ft with a range of 343-817 ft. Largest range of thickness was 1,100 ft, from to 300-1,400 ft, in 4 reservoirs with 16% porosity.
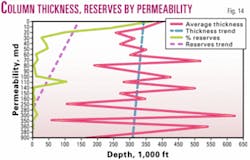
Highest average oil column thickness was 624 ft in three reservoirs with 300-309 md permeability (Fig. 14). The highest oil column thickness of 1,400 ft was in one reservoir with permeability of 50-59 md. Smallest oil column thickness was in 55 ft in one reservoir with permeability of 350-359 md.
Highest permeability of 900-909 md had an oil column thickness of 100-200 ft, and the lowest permeability of 0-9 md had an average thickness of 397 ft with a range of 70-1,200 ft. Largest range of thickness was 1,345 ft, from 55 to 1400 ft, in 12 reservoirs with 50-59 md permeability.
One of four largest reservoirs had no oil column thickness listed. The other three had thicknesses of 330 ft, 486 ft, and 700 ft.
Parameters vs. thickness
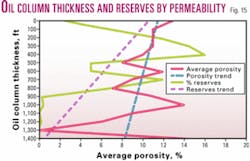
Largest number of reservoirs, 44 or 19% of the total, had an average thickness of 231 ft with a range of 200-299 ft, and largest reserves, 16% of the total, had an average thickness of 428 ft with a range of 400-489 ft.
Largest reserves were 3.1 billion bbl, 16% of the total, in 22 reservoirs, 10% of the total, with an average thickness of 428 ft and a range of 400-489 ft. After reaching a maximum at less than 500 ft, both the number of reservoirs and amount of reserves decreased with an increase in oil column thickness.
Average porosity decreases with an increase in oil column thickness (Fig. 15). Highest average porosity of 13% was in 14 reservoirs at a thickness of 0-99 ft with a range of porosity of 2-22%. Lowest average porosity of 1% was in one reservoir 900 ft thick.
Widest range of porosity was 4-25% at a thickness of 200-299 ft. Largest number of reservoirs was 44 with a thickness of 200-299 ft and an average porosity of 11% with a porosity range of 4-25%.
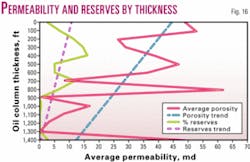
Average permeability decreases with an increase in oil column thickness (Fig. 16). Highest average permeability was 53 md in 42 reservoirs with a thickness of 147 ft with a range of 0-903 md. Lowest average permeability was 1 md in one reservoir 900 ft thick.
Widest range of permeability was from 0 md to 903 md at thickness of 100-199 ft. Largest number of reservoirs was at a thickness of 200-299 ft with an average permeability of 26 md with a permeability range of 1-150 md.
Water saturation
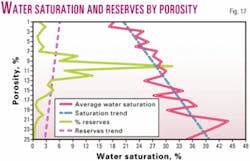
Average water saturation was 28% with a range of 4-60%. The largest number of reservoirs had an average water saturation of 28% with a range from 16% to 40%.
Highest average water saturation was 44% in two reservoirs with porosity of 21% (Fig. 17). Highest water saturation was 60% in one reservoir with 15% porosity, and the lowest water saturation was 4% in one reservoir with 2% porosity.
Water saturation at 25% porosity was 34% with a range of 30-38%, and water saturation at 1% porosity was 16% with a range of 4-46%. Largest range of water saturation was 40%, from 20% to 60%, in 15 reservoirs with porosity of 15%.
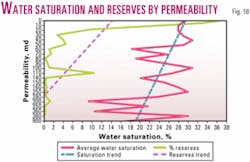
Largest number of reservoirs, 83 were in the interval with permeability of 0-9 md (Fig. 18). Highest average water saturation was 55% in two reservoirs with 160-169 md permeability.
Highest water saturation of 60% was in one reservoir with 0-9 md permeability, and lowest water saturation of 4% was in one reservoir with 0-9 md permeability. Water saturation at 900-909 md was 16%, and water saturation at 0-9 md was 29% with a range of 4-60%.
Largest range of average water saturation was 54%, from 4% to 60%, in the 83 reservoirs with permeability of 0-9 md.
Two of the four largest reservoirs had 20% water saturation, one had 22%, and one had 25%.
Reservoir pressure
Average pressure was 2,746 psi with a range from 419 psi to 6,031 psi. The largest number of reservoirs had an average pressure of 2,000-2,500 psi with a range of 700-3,957 psi, and the largest percent of reserves were also in the 2,000-2,500 psi interval.
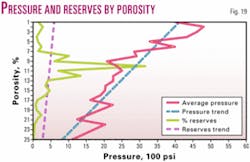
Highest average pressure was 4,833 psi with a range of 2,625 psi to 5,834 psi at a porosity of 2% (Fig. 19). Highest porosity of 25% had a pressure of 1,000-1,500 psi, and the lowest porosity of 1% had a pressure of 3,815 psi with a range of 3,315-4,630 psi. Largest range of pressures was 3,819 psi, from 2,212 psi to 6,031 psi, at a porosity of 3%.
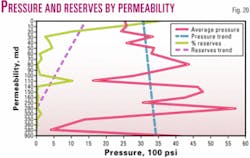
Highest average pressure was 4,380 md with a range of 3,419-5,350 psi at a permeability of 80-90 md (Fig. 20). Highest permeability of 900-909 md had a pressure of 4,401 psi, and the lowest permeability of 0-9 md had a pressure of 2,537 psi with a range of 750-5,770 psi. Largest range of pressure was 5,421 psi, from 610 psi to 6,031 psi, at a permeability of 10-19 md.
Pressure in the four largest reservoirs was 700 psi, 1,710 psi, 1,850 psi, and 3,122 psi.
Reservoir temperature
Average temperature was 110° F. with a range of 80-216° F. Largest share of reserves had an average temperature of 122° with a range of 80-164°.
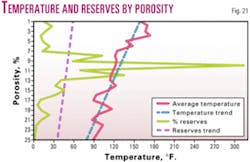
Highest average temperature was 175° with a range of 138-193° at porosity of 4% (Fig. 21). Lowest average temperature was 86° with a range of 81-90° in two reservoirs with porosity of 21%.
Temperature in two reservoirs at 25% porosity was 88°, and temperature at 1% porosity in three reservoirs averaged 157° with a range of 120-201°. Largest range of temperatures was 103-216° at six reservoirs with porosity of 3% porosity.
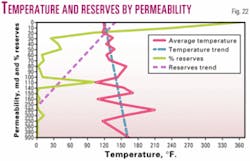
Highest average temperature was 210° in one reservoir with permeability of 280-290 md (Fig. 22). Lowest average temperature was 105° with a range of 82-128° at permeability of 110-119 md.
Temperature in one reservoir with permeability of 900-909 md was 166°, and average temperature in reservoirs with permeability of 0-9 md was 120° with a range of 80-204°. Largest range of temperatures was 129° in 16 reservoirs with a range of 81-210°.
Temperature in the four largest reservoirs was 82°, 107°, 108°, and 130°.
Oil gravity
Average gravity was 39° with a range of 24-54°.
The largest number of reservoirs had gravity of 39-40°, and the largest percent of reserves had gravity of 29-30°.
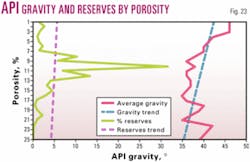
Highest average gravity was 46° at porosities of 1% with a range of 40-53°, porosity of 2% with a range of 37-54°, and porosity of 3% with a range of 40-53° (Fig. 23).
Average gravity at 25% porosity was 39° with a range of 38-40°. Average gravity at 1% porosity was 46° with a range of 40-53°.
Largest range of gravity was 29° from 24-53° at porosity of 6%.
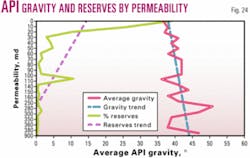
Highest average gravity was 47° in three reservoirs at permeability of 300-309 md with a range of 43-53° and in one reservoir with a permeability of 900-909 md (Fig. 24).
Lowest average gravity was 36° with a range of 30-41° at permeability of 110-119 md. Highest permeability of 900-909 md had a gravity of 47°, and lowest permeability of 0-9 md had an average gravity of 37° with a range of 24-50°.
Widest range of gravity was 26° from 24-50° at permeability of 0-9 md.
Two of the four largest reservoirs had gravity of 20°, one had gravity of 22°, and one had gravity of 25°.
Gas-oil ratio
Average GOR was 636 with a range of 19-4,000. The largest number of reservoirs had an average GOR of 685 with a range from 38-1,290.
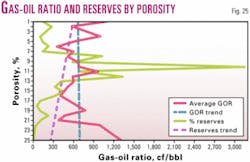
Highest average GOR 1,327 was in two reservoirs with a porosity of 25% (Fig. 25). Lowest average GOR was 336 with a range of 29-800 in six reservoirs with porosity of 10%.
Lowest porosity of 1% had a GOR of 1,073 with a range 669-1,701. Largest range of GOR was 3,900 from 100-4,000 in 13 reservoirs with 11% porosity.
One of the four largest reservoirs had GOR of 38, one had 460, one had 700, and one had 1,010.
Comparison of two areas
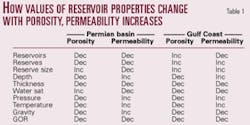
This data compilation permitted comparison of how property values increased, decreased, or remained the same with increases in porosity and permeability in the Permian basin and the Gulf Coast (Table 1).
The values reacted the same in depths, oil-column thickness, pressures, temperatures, and GORs. With increases in porosity, the number of reservoirs, amount of reserves, and water saturation were opposite in the two areas. With increases in permeability, the amount of reserves and reserve sizes were reversed.
In neither case could the acreage sizes be examined as no or little data were available for reservoirs with less than 100 million bbl of reserves.
What was learned
The three questions asked at the beginning may be answered as follows:
1. Average permeability tended to increase with an increase in porosity. Average porosity tended to remain basically the same or increase slightly with an increase in permeability. Apparently as one property value increases, the other increases slightly or remains the same. This applies only to the averages and not to the low and high range of values of each.
2. Percent of reserves increased with an increase in average porosity until 10% porosity was reached and then decreased. As average permeability increased, the percent of reserves decreased except for an increase in reservoirs with permeability of 110-119 md. This would seem to indicate some other values were more important to the amount of reserves present.
3. Average porosity increased slightly with an increase in reserve size. Average permeability decreased slightly with an increase in reserve size.
4. As porosity increased the average depth decreased, and as permeability increased the average depth increased. As depth increased, average porosity decreased. As depth increased, average permeability increased.
The number of reservoirs increased with increases in porosity until 10% porosity was reached, and then it decreased. The number of reservoirs was highest in the lowest group of permeability measurements and then decreased.
Average oil-column thickness decreased with an increase in porosity and with an increase in permeability. Porosity and permeability decreased with increased oil-column thickness. Percent water saturation increased with an increase in porosity but decreased with an increased permeability.
In several cases the effect of porosity and permeability on reservoir properties was opposite. As porosity increased, depth and oil-column thickness decreased, and water saturation increased. As permeability increased depth increased, but oil-column thickness and water saturation decreased. The changes were not expected, and they lead one to wonder how much relationship there is between porosity and permeability.
Relationships of porosity and permeability with fluid properties may be summed up quickly. Except in the case of GORs, as the porosity increased the properties decreased. As the permeability increased, the properties increased. With GOR the average porosity remained the same and the average permeability decreased. As porosity and permeability increased, GOR, gravity, and temperature decreased, and pressure decreased with increased porosity and increased with an increase in permeability.
In nearly all cases it was amazing at how irregular the increases and decreases in each property were with increases in porosity and permeability. In many cases it was amazing how the increases and decreases in the percent of reserves have no relationship to increases and decreases in the various properties.
The fact that the percent of reserves decreased regardless whether other properties decreased or increased would indicate that another property is more important. This may be proved acreage, but without more information it is impossible to demonstrate.
Bibliography
Galloway, W.E., Ewing, T.E., Garrett, C.M., Taylor, N., and Bebout, D.G., "Atlas of Major Texas Oil Reservoirs," Bureau of Economic Geology, Austin, 1983.
Haeberle, F.R., "Study of Reservoir Properties Can Yield Exploration Clues," OGJ, June 21, 1999, pp. 62-65.
Haeberle, F.R., "Permian Basin Reserves And Reservoir Properties By Age," West Texas Geological Society Bull., November 2001, pp. 4-10.
Haeberle, F.R., "Porosity and Permeability Effects In Texas Gulf Coast Reservoirs," OGJ, Mar. 15, 2004, pp.30-35.
Landes, K.K., "Petroleum Geology of the United States," Wiley Interscience, New York, 1970, pp. 219-282.
The author
F.R. Haeberle ([email protected]) is a consulting geologist who moved to Delaware, Ohio, after 20 years in Dallas. He has worked for Standard Oil Co. of Texas, Atlantic Refining Co., Mobil Oil Corp., Mayfair Minerals, and J.J. Lynn Oil Division. He holds BS and MS degrees in geology from Yale University and an MBA degree in finance from Columbia University Graduate Business School.
