Mounting US energy demand pressures 2004 market
Booming economies in the US and elsewhere will bolster energy demand this year, but the extent to which high energy costs will limit economic growth or to which increased energy conservation will ensue is as yet unknown.
The US economy will grow in 2004, as will total energy demand, while realizing greater energy efficiencies. OGJ forecasts that US oil demand will increase more than 2% this year, and natural gas, coal, and nuclear energy demand also will grow but by smaller margins.
Estimates of worldwide oil demand continue to rise, prompting action by large crude exporters to supply the volatile market, which has seen prices surge and remain strong due to a host of factors.
US oil production will be off from last year, increasing the need for imports, and US refineries will operate in excess of 93% to meet gasoline and jet fuel demand this year. OGJ anticipates that industry inventories of crude will build, but product stocks will remain tight.
International developments
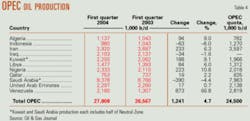
To alleviate a perceived shortage of crude oil on the market and high oil prices, members of the Organization of Petroleum Exporting Countries met in Beirut on June 3, 2004, to raise the group's official output ceiling.
The ministers agreed to raise quotas to a collective 25.5 million b/d, up from the ceiling of 23.5 million b/d, which had been in effect since Apr. 1, for the members of the organization excluding Iraq. The group also agreed to raise the output ceiling by an additional 500,000 b/d on Aug. 1. This decision served to legitimize the overproduction already taking place.
There was an expectation that worldwide oil demand would dip, as it usually does, in the second quarter, and the market looked to be well supplied. Therefore, exporters did not take any official steps to boost output before May, although production already exceeded the output ceiling.
But fears that high energy prices would curtail global economic growth prompted OPEC to act to achieve reasonable oil prices. The organization noted that the price of oil was not being driven by market fundamentals but rather by a combination of factors outside its control. Among these factors is higher-than-expected oil demand growth, especially in the US and China. Also, prices are believed to be propped up by a large number of speculators and fund managers in the futures market, by a security premium amid attacks aimed at disrupting supplies, by geopolitical concerns including instability in Iraq, and by tightness in the US gasoline market buoyed by stringent new product specifications.
At the press conference at the close of the June 3 meeting, OPEC conference Pres. and Sec. Gen. Purnomo Yusgiantoro said the increase was planned in two stages because a number of uncertainties still affected the international oil market.
In the third quarter, demand is expected to rise. OPEC members plan to meet in Vienna on July 21 to review the situation and take into account the most recent developments, as estimates of demand growth continue to be revised up and supply tries to catch up with the revised demand growth forecasts. A lack of sufficient investment by OPEC over the last decade is placing the spotlight on the amount of spare production capacity within the organization. The problem is that the only member with any appreciable excess capacity is Saudi Arabia, which is threatened by further terrorism following attacks on western personnel and oil firms there in May.
Production
Non-OPEC crude exporters will be expected to supply additional oil to the market to meet global demand. Mexico proposed to pump an extra 70,000 b/d in the second half of this year, raising exports to 1.95 million b/d.
Russia, which has ramped up production considerably and is now the world's second largest oil exporter, has raised oil production sharply in recent years but is running into export constraints due to pipeline bottlenecks.
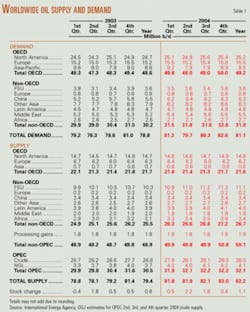
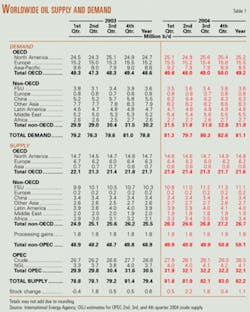
International Energy Agency projections show that oil production in countries belonging to the Organization for Economic Cooperation and Development (OECD) will dip 100,000 b/d to 21.6 million b/d this year.
Paris-based IEA also forecasts that outside the former Soviet Union there will be only marginal changes in output by countries outside the OECD.
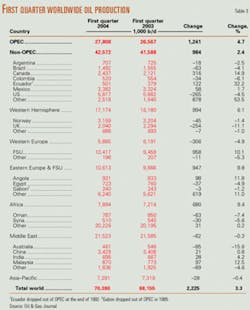
OGJ estimates that during the second quarter of 2004, crude oil exported by members of OPEC, excluding Iraq, averaged 28.1 million b/d, up from an IEA estimate of 27.9 million b/d during the first quarter. This contributed to a stockbuild of 2.2 million b/d in the second quarter.
OGJ also expects that OPEC output will be little changed throughout the remainder of the year, such that the average stockbuild for 2004 will be 1.1 million b/d.
Worldwide demand
IEA forecasts that global oil demand will average 80.2 million b/d in the third quarter and grow to 82.5 million b/d in the fourth quarter.
The US, India, and China are fueling much of the run-up in worldwide demand. IEA forecasts India's demand will average 2.44 million b/d, up from 2.33 million b/d last year and 2.29 million b/d in 2002. IEA forecasts oil demand in the US this year will climb to an average 20.38 million b/d, up from 20.07 million b/d last year.
Since implementing structural reforms, China over the past 20 years has achieved annual gross domestic product growth of more than 9%, and its share of world trade has risen to almost 6% from less than 1%, according to the International Monetary Fund's recent World Economic Outlook.
As a result of this growth, IMF says, China now rates as the sixth-largest economy and is the fourth-largest trader in the world. Further, the analysis says that the country's growth can continue to increase rapidly if the necessary structural reforms, including those in the financial and enterprise sectors, labor markets, and social safety nets, continue to be implemented.
Crude oil prices
Fears of a supply disruption are keeping crude prices high in a well-supplied market. Speculators worry that even a small terrorist-caused disruption to oil supplies could cause major repercussions that wreak havoc with the supply chain.
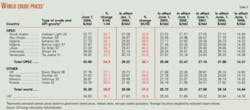
The near-month contract for oil on the New York Mercantile Exchange peaked on June 1 at $42.33/bbl for July delivery. The next day, the closing price was $39.96/bbl.
The OPEC reference basket price, the average of seven selected crudes, also peaked on June 1 at $37.64/bbl, well above the organization's self-imposed price band of $22-28/bbl. In reaction to the outcome of OPEC's June 3 meeting, the near-month futures price of oil on NYMEX closed that day at $39.28/bbl, down only $0.68/bbl from the previous day's trading.
At that time the futures strip began to return to backwardation, the state in which a premium is placed on the prompt delivery of crude, in anticipation of larger supplies of oil coming onto the market in August and beyond.
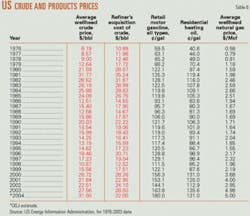
The average US wellhead price of oil was $31.47/bbl in the first quarter of this year vs. $30.10/bbl for the same period last year and $17.70/bbl in the first 3 months of 2002. OGJ forecasts that this year's average wellhead price of crude in the US will be $31/bbl, up from $27.56/bbl last year.
Product prices
High oil prices, low inventories on top of soaring demand, fears of supply disruptions, and tough product specifications caused product prices to rally in the first half of 2004.
The OGJ weekly survey of US unleaded motor gasoline pump prices shows a nationwide average of $1.74/gal in the first 5 months of this year, up from $1.59/gal for the same period last year and $1.25/gal for the same 2002 period.
OGJ's survey also showed that this year the first 5 months' average gasoline pump price excluding all taxes was $1.33/gal vs. $1.18/gal a year earlier.
The 2003 US retail motor gasoline price for all grades—including taxes—averaged $1.64/gal, according to the US Energy Information Administration. In 2002, the price averaged $1.44/gal. OGJ forecasts that the average pump price for all grades of gasoline will be $1.80/gal this year.
Residential heating oil prices also jumped last year and remain strong, although they are trending lower. Inventories of distillate fuel oil in the US were greater in the winter months of this year than at the same time last year. At the end of February, distillate stocks were 111.3 million bbl, up from just 97.2 million bbl at the end of February 2003. Residential heating oil prices in the first quarter of this year averaged $1.42/gal, down from $1.46/gal in the same quarter last year. OGJ predicts that residential heating oil will average $1.31/gal this year, down from the 2003 average of $1.36/gal.
Natural gas prices
Stocks of natural gas were larger at the beginning of this year than at the start of 2003. But as gas supply fears mounted, and since gas prices normally track oil prices, wellhead and futures prices for gas moved up this year.
Concerns of a gas shortage in the near future have mounted amid quickening decline rates and were heightened following statements by Federal Reserve Board Chairman Alan Greenspan expressing unease about US gas supplies. The wellhead price of gas in the US averaged $5.53/Mcf during January, up from $4.47/Mcf a year earlier. For all of last year, the wellhead price averaged $4.98/Mcf, and OGJ forecasts that this year the price will be nearly unchanged at $5/Mcf.
The front-month futures price of gas on the NYMEX during January averaged $6.27/MMbtu vs. $5.38/ MMbtu a year earlier. The NYMEX price closed at a 2004 high of $7.287/ MMbtu on Jan. 9 for gas delivered in February.
US economy
Real GDP, the total output of goods and services in the US, increased at an annual rate of 4.4% in the first quarter, according to preliminary estimates released by the US Department of Commerce's Bureau of Economic Analysis (BEA). In the last quarter of 2003, real GDP increased 4.1%.
The major contributors to the increase in real GDP in the first quarter were personal consumption expenditures, equipment and software, private inventory investment, federal government spending, and exports. Imports, which are a subtraction in the calculation of GDP, increased, BEA said.
OGJ forecasts 2004 GDP growth of 4.3%. This compares with growth of 3.1% last year and 2.2% in 2002. Annual GDP growth in 2001 was just 0.5%. This will be the 13th consecutive year of economic growth in the US following a 0.2% contraction in 1991.
The economic recovery has been fueled by low interest rates as US homeownership has grown to 68.6% in the first quarter of this year from 67.1% in the first quarter of 2000, according to the US Census Bureau.
Unemployment statistics also indicate recovery. The number of unemployed persons was unchanged at 8.2 million in May, and the unemployment rate held at 5.6%, the Bureau of Labor Statistics (BLS) reported last month. The unemployment rate has been either 5.6% or 5.7% in each month since December 2003, the agency noted. In May of last year, the unemployment rate was 6.1%. BLS also reported that average weekly earnings rose by 2.5%, seasonally adjusted, from April 2003 to April 2004. Additionally, productivity grew at the seasonally adjusted annual rates of 4.6% in the business sector and 3.8% in the nonfarm business sector during the first quarter.
Industrial production moved up 0.8% in April after having dipped 0.1% in March, according to the Federal Reserve Board, which also reported that total industry capacity utilization rose to 76.9%, a rate 0.5 percentage points above that of its first-quarter average but still more than four percentage points below its 1972-2003 average.
US energy demand
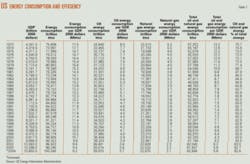
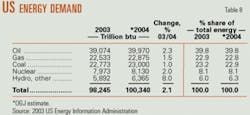
With increased economic output, the US will require more energy than last year. OGJ forecasts that total energy demand will be 100.34 quadrillion btu (quads). This would be an annual increase of 2.1%.
US energy consumption was nearly unchanged last year, posting the slightest uptick in 2003. In 2002, however, demand grew to 98.2 quads from 96.3 quads a year earlier. Total US energy demand peaked in 2000 at 98.9 quads.
Energy efficiency, the amount of energy consumed per dollar of GDP, will improve slightly this year to 9,250 btu/$1 from 9,450 btu/$1 in 2003. The energy efficiency ratio has improved nearly each year since 1970.
Energy by source
OGJ forecasts that US demand for all sources of energy will grow this year. Oil and gas will continue to account for almost two thirds of all energy consumed, as coal gains market share and nuclear energy use is steady. Renewable energy use will gain this year as well.
US consumption of oil will be 39.97 quads, increasing 2.3%. This follows a 1.75% increase last year. Petroleum products, including transportation fuels and home heating oil, will supply 39.8% of all energy used in the US, the same share of the market that it held last year.
Gas consumption will gain 1.5% and hold a 22.8% share of the energy market. This compares to a 4.7% drop in gas demand last year, as high prices caused industrial demand to falter. Also, the use of gas for electric power generation retreated to 4.93 tcf from a 2002 peak of 5.67 tcf.
Demand for coal will continue to rise, spurred by economic recovery, high oil and gas prices, and strong demand for electricity. Coal demand will move up 1% this year and account for 22.9% of the US energy market, which is down from its 2003 market share of 23.2%. Last year, US coal consumption reached 22.77 quads, surpassing its previous high set in 2000, at 22.58 quads. Almost 92% of all coal consumed in the US was in the electric power sector. But all of the coal consuming sectors had increased coal demand in 2003, something not experienced since 1987, according to EIA.
Nuclear energy use will increase 2% in 2004 after declining to 7.97 quads in 2003 from 8.14 quads a year earlier. Nuclear energy's market share will remain at 8.1%.
EIA said that part of the decline in nuclear generation last year was a consequence of the shutdown of nine reactors in the northeastern US as a result of a massive regional blackout in August. EIA estimates that the total days of lost generation by those reactors was 43 days. Capacity utilization by nuclear units last year was 88.4%, down from a peak of 90.4% in 2002 and 89.4% in 2001.
Use of energy from hydroelectric power and all remaining sources will grow 8% this year, totaling 6.37 quads. The other renewable energy sources in this category are wood, waste, alcohol fuels, geothermal, solar, and wind power. This category's 2004 share of the energy market will be 6.3%, up slightly from a year ago.
Natural gas forecast
In addition to economic growth, several factors will contribute to higher gas demand in the US this year.
Warmer-than-normal summer weather will drive gas demand in the power generation sector. So far this year, the number of cooling-degree-days exceeds last year's number and the normal range for 1971-2000.
While gas use for electric generation ramps up, industrial demand for gas will be little changed from last year. US industrial use of gas peaked in 2000, at 8.4 tcf, then totaled 7.3 tcf in 2001, 7.6 tcf in 2002, and 7.0 tcf last year.
Demand for gas by electric power consumers dipped last year to 4.9 tcf from 5.7 tcf a year earlier. Meanwhile, residential and commercial demand grew slightly.
Stocks and production of coal are down—and coal prices are higher—such that fuel switching to gas from coal is up this year. High gas prices will limit demand growth somewhat, though.
The Climate Prediction Center of the National Weather Service (NWS) in May issued a report that called for 12-15 tropical storms, with 6-8 becoming hurricanes, and 2-4 of these becoming major hurricanes in the Atlantic Ocean this year. Production in the Gulf of Mexico could be affected on the downside if hurricanes force any suspensions in production at offshore locations. Additionally, NWS has called for a warm- er-than-normal summer in most of the US. If this proves correct, demand will swell from a year ago.
Following a mild fourth quarter 2003 that allowed inventories to build, a cold January and February drew down stocks of gas somewhat. This spring, however, inventories remained in the middle of the 5-year average range.
While sufficient supplies might normally put downward pressure on prices, gas prices have been supported this year by high oil prices.
Gas drilling activity is up. The number of gas-directed drilling rigs operating in the US at the end of May was 1,012, according to Baker Hughes Inc. This is up from 896 rigs a year earlier, as new pipelines to take gas out of the Rocky Mountains have spurred development activity there. The number of gas-directed drilling rigs in the GOM, however, fell to 87 from 104 for the same period.
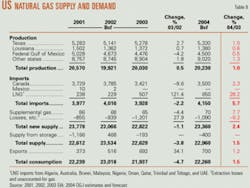
US production of gas will increase just 1%, as decline rates battle with drilling efforts and new pipeline capacity. Increased investment in bringing online unconventional gas supplies is also helping to avoid a decline in US gas production, essentially keeping output flat. Areas for production growth this year will be the US Rockies and along the Gulf Coast, as well as in the deepwater GOM.
Total US gas imports will increase more than 3%. Imports from Canada will increase this year as well completions there surge, and gas imports from Mexico will be nil again this year due to higher demand in that country.
Mexico, in fact, has become a growing destination for US gas exports. Last year, the US exported 333 bcf to Mexico, up from 263 bcf a year earlier and 141 bcf in 2001.
US LNG imports will continue to grow this year, but short-term growth is limited. OGJ anticipates that the US will import 650 bcf of LNG, up from 507 bcf last year and 229 bcf in 2002.
Any new LNG regasification terminals in the US are still in the planning, permitting, and construction stages, and it looks as though little new capacity will be completed and operational before 2006.
US petroleum demand
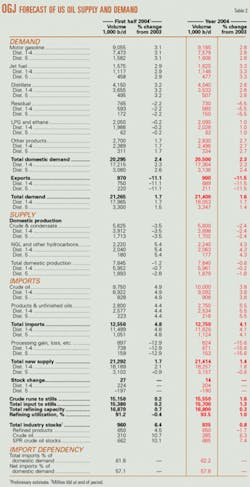
OGJ forecasts 2004 demand for petroleum products in the US will grow to 20.5 million b/d, up from 2003 demand of 20.0 million b/d. Despite higher prices for products, the bustling economy and greater consumer spending power are boosting demand, especially for gasoline.
Figures from the BEA indicate a trend that spending on gasoline and oil as a share of total personal consumption expenditures has been declining. During the 1990s, such spending represented an average 2.86% of total personal spending, but during 2000-02, gasoline and oil spending fell to 2.6%.
Last year, there was a further decline to 2.39%. In the first quarter of this year, spending on oil and gasoline accounted for only 2.46% of total personal consumption expenditures, despite the surge in gasoline pump prices.
Motor gasoline
US motor gasoline demand will grow 2.8% this year. Demand for gasoline last year posted a 1% gain to average 8.94 million b/d. Year-on-year growth was stronger in the first 5 months of this year, as last year's high prices and still-sluggish economy placed a cap on demand.
For the remainder of 2004, year-on-year growth will be less marked. Inventories of gasoline began building at the end of May following increased refinery utilization levels.
EIA reported that on June 7, the national average retail price of regular grade gasoline decreased to $2.034/ gal, which was up $0.544/gal from a year earlier. Strong growth in personal income appears to be the primary reason why demand has not plunged.
The most recent EIA data on motor vehicle fuel rates indicate that for 2002, the number of miles per gallon for all motor vehicles declined to 17 mpg from 17.1 mpg a year earlier. The rate held at 22.1 mpg for passenger cars and 17.6 mpg for vans, pickup trucks, and sport utility vehicles. For all other trucks, the fuel rate dropped to 5.8 mpg from 5.9 mpg in 2001.
Jet fuel
Demand for jet fuel will increase this year following a 2003 decline. During the first 9 months of last year, jet fuel demand dropped from its year-earlier level, such that for the year demand fell 2.5%.
OGJ predicts that jet fuel consumption will average 1.625 million b/d this year, a 3.2% build over a year ago. Airline passenger traffic continues to grow. Air Transport Association data show April enplanements up 12% from a year earlier. This compares to a 5.5% year-on-year increase recorded in March.
Residual fuel oil
Unlike other petroleum products, residual fuel oil will incur a decline in demand this year. OGJ predicts that resid demand will average 730,000 b/d this year for a 5.4% decline vs. a year ago.
As resid prices are up substantially from a year ago, demand has dropped. EIA figures show that resid at New York Harbor cost 73.52¢/gal for the week ended June 4; this compares with 57.74¢/gal a year earlier. Nonetheless, resid remains cheaper than natural gas.
In spite of its cost advantage on a btu basis, use of resid by power generators over the years has dropped in favor of cleaner-burning natural gas. Resid demand peaked in 1977 at 3.1 million b/d.
Distillate
Industrial production growth caused by economic recovery is giving distillate demand a boost. OGJ forecasts a 2.6% increase in distillate consumption this year to an average 4.04 million b/d.
The gain is powered by a jump in the use of low-sulfur diesel fuel for increased transportation and by the need for high-sulfur home heating oil amid low temperatures recorded earlier this year.
LPG, other products
Demand for LPG and ethane in the US also will gain this year, though by a smaller margin than the products already covered here. OGJ expects that demand will average 2.09 million b/d, edging up just 1.1%. Demand for some petrochemical feedstocks is up from a year ago.
US demand for all other products will increase 2.7%. This category includes gasoline blending components, unfinished oils, and other products such as asphalt, all of which are in higher demand as the economy grows.
US petroleum supply
Total US liquids production will decline modestly to 7.885 million b/d. This includes production of crude, condensate, natural gas liquids, and other liquids. A drop in crude and condensate output will offset gains in the production of all other liquids.
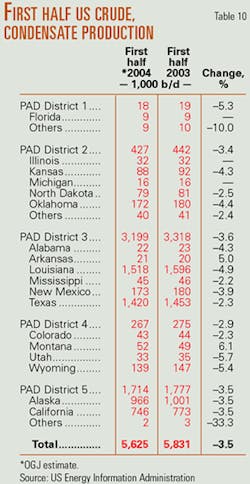
OGJ projects that US crude and condensate production will decline 2.4% this year. This will take output to 5.6 million b/d, continuing a string of declines since 1991.
EIA estimates that average production last year fell just 9,000 b/d. In 2002, US crude and condensate production declined 55,000 b/d to 5.746 million b/d.
Estimates also indicate that Alaskan crude and condensate production last year fell 10,000 b/d from a year earlier to average 974,000 b/d. For the first 4 months of this year, EIA estimates that Alaskan production fell further to average 963,000 b/d. Production of crude and condensate in Alaska peaked in 1988, averaging 2 million b/d.
US production of NGLs and other liquids will gain more than 4% this year to average 2.24 million b/d. Recent high gas prices have lessened the economy of taking NGL out of gas streams.
Additionally, a smaller amount of NGLs was required as petrochemical feedstock.
Last year the US produced 1.72 million b/d of NGLs as compared with 1.88 million b/d in 2002.
Imports
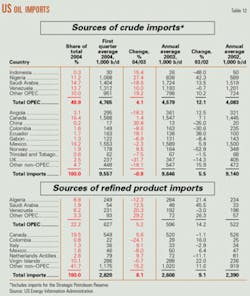
Gross and net US imports of crude oil and products are up from a year ago, and OGJ sees them staying robust for the remainder of the year.
In the first half of this year, crude imports increased nearly 5% from a year ago. In the second half, the year-on-year change will be less pronounced, as imports soared in the last 6 months of 2003.
OGJ forecasts that for this year, crude imports will achieve a 3.8% annual gain. This does not include any oil imported for the Strategic Petroleum Reserve (SPR).
No oil was imported for the SPR during 2003, and only an average of 16,000 b/d was imported during the previous year for the reserve.
The largest source of US crude imports during 2003 was Saudi Arabia, which exported an average 1.7 million b/d of crude to the US. The second largest exporter of crude to the US was Mexico with 1.59 million b/d of crude, followed by Canada, Venezuela, and Nigeria.
The sixth largest source of US crude imports last year was Iraq, which sent an average of 470,000 b/d. US crude imports from Iraq reached their highest level in 2001, averaging 795,000 b/d.
Product imports will grow 5.5% from last year, averaging 2.75 million b/d. Product import growth in the first half of this year has been slightly weaker than crude import growth but will increase in the second half.
Most US product imports last year came from Canada, followed by the US Virgin Islands, Algeria, and Venezuela.
Inventories
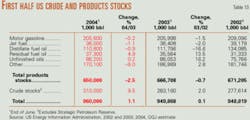
Because of growing demand, industry stocks of crude and products have tested minimum operating levels for more than a year.
Stores of crude oil ended 2003 at 268 million bbl, down from a year earlier and well below the 5-year average for crude inventories.
Crude stocks gained in the first half of this year, ending May at just over 300 million bbl, a level not seen since July 2002, when crude stocks were 304 million bbl. OGJ expects crude stocks to end this year at 285 million bbl.
In 2004, inventories of crude in the SPR will build for the fourth consecutive year. OGJ forecasts a substantial increase, as the SPR grows to 685 million bbl at the end of this year from 638 million bbl at the end of 2003.
Robust demand will keep product stocks tight throughout 2004. Motor gasoline stocks built in the first half of this year to about 208 million bbl but remained below year-earlier levels and below the 5-year average.
Jet fuel and resid stocks at the end of the first 6 months were also tight, but inventories of distillate were up from a year earlier.
OGJ forecasts that at the end of 2004, product stocks will remain below 2003 levels. Total petroleum product stocks will be 650 million bbl, down from 661 million bbl a year earlier.
Refining
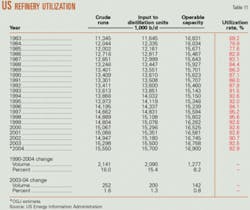
With operable capacity of 15,800 b/d, refinery utilization this year will average 93.5%, OGJ forecasts.
This year, refinery inputs averaged an all-time high for the first quarter, American Petroleum Institute said. Strong gains in January and February offset a 1.5% decline in March. April's average utilization rate of 92.5% was down slightly from a year earlier, but gasoline production reached the all-time highest April level on record, according to the Washington-based institute.
Refiners have been pressed to supply enough product to a growing market just as fuel specifications have become more stringent.
Additional pressure came as second quarter 2004 demand failed to decline, as it typically does that time of the year and when refiners schedule routine maintenance.
The price that refiners pay for crude began a steady ascent in the final quarter of last year, and that trend has continued to presstime. The refiners' acquisition cost of crude during the first 4 months of this year averaged $32.37/ bbl vs. $20.48/bbl for the same 2003 period.
Refining margins have been strong. The US Gulf Coast refining margin for West Texas Sour crude was $10.31/bbl in May, up from $3.59/bbl a year earlier, according to Pace Consultants Inc. The May margin also climbed from $9.13/bbl in April and $7.17/bbl in March.
The US West Coast refining margin in Los Angeles during May averaged $21.59/bbl, Pace reported. This compares with $4.28/bbl during the same month of 2003.
