Here's a different way to evaluate chartering alternatives
Oil company chartering managers must decide between chartering or not chartering and, if chartering, for what length of time. The problem is that only time can prove correct or incorrect whatever decision the manager makes today.
The method suggested in this article accounts for the imponderable nature of future charter rates for chartering decisions made in the present.
Spot tanker rates exhibit extreme volatility depending on the relationship between the number of cargoes and the number of ships.
If the number of cargoes exceeds the number of ships, rates rise considerably. If the number of ships exceeds the number of cargoes, rates fall considerably. The middle ground is usually a matter of transition from a weak to a strong market or from a strong to a weak market.
When the spot market is depressed, however, a charterer cannot lock in low rates on a long-term basis because an owner would be better off laying up or scrapping a vessel. On the other hand, when rates are extremely high, charterers become reluctant to lock in high rates on a long-term basis.
Moreover, charterers have the ability to order a vessel that fixes their costs of transportation. Thus, an owner cannot offer a charter rate higher than what would be equivalent if the charterer decided to own rather than charter a vessel. In fact, an owner must offer an inducement to get a charterer's attention; that is, offer a charter rate that is less expensive than ownership.
Simulations
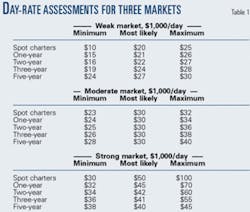
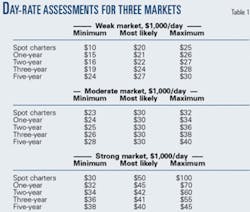
Simulation can aid in establishing a tanker charter policy for a fleet of vessels. To demonstrate the use of simulation, suppose that an oil company is investigating the optimal chartering policy for four vessels. The day-rate assessments for weak, moderate, and strong markets are shown in Table 1.
In a weak market, the most likely charter rate increases as charters become longer, whereas in a strong market, the most likely charter rate decreases as charter periods become longer, and the moderate market has the same charter rate for all charter periods.
Suppose that we are attempting to obtain an optimal chartering policy covering a 20-year period in which the chance of a weak market is 60%, a moderate market 25%, and a strong market 15%. This can be set up in an Excel spreadsheet using @Risk simulation software (Fig. 1).
Row 12 is the year number, Row 13 the state of the market (0 means weak, 1 moderate, 2 strong). Every iteration of a simulation creates another market scenario of market conditions over a 20-year period.
Simulations of 10,000 iterations were run for three cases: all four vessels in the spot market, all four with simultaneous 5-year charters, and a mixed charter portfolio consisting of one vessel with a 1-year charter, one with a 2-year charter, one with a 3-year charter, and one with a 5-year charter. The results follow.
In spot market
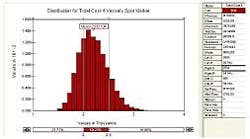
Fig. 2 shows the average result is $2,200. This is the summation of the daily hire for four vessels for 20 years.
Actual total hire would be $2,200 multiplied by 365 days and by $1,000, or about $800 million in charter hire payments for four vessels over 20 years.
If we take $2,000 and $2,500 as points of interest, the probability of annual hire being less than $2,000 is 25.7% and being greater than $2,500 is 15.1%. The maximum value achieved in the simulation is $3,578.
Simultaneous charters
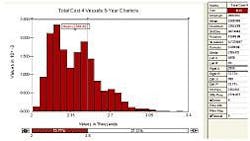
This alternative is the simultaneous fixing of four vessels on 5-year charters, which are renewed four times during the 20-year simulation.
Fig. 3 shows that the mean is $2,388 with a 0% chance of aggregate charter hire being less than $2,000 and 27.2% chance of aggregate charter hire being greater than $2,500 with a maximum of $3,352.
Mixed portfolio
The next simulation (Fig. 4) is based on vessel on a 1-year charter, another on a 2-year charter, a third on a 3-year charter, and the fourth on a 5-year charter.
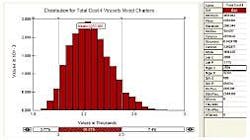
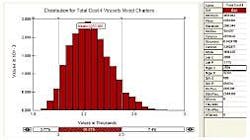
Here the aggregate total has a mean of $2,254, a maximum of $2,942, a 3.8% chance of being less than $2,000, and a 7.4% chance of being greater than $2,500. Table 2 summarizes the results.
Distribution for total cost for four vessels on mixed charters (Fig. 4).
Best choice
Of these three choices, which is the optimal chartering policy?
The lowest-cost alternative is the spot market with a mean cost of $2,200. This alternative also provides the greatest probability of paying the lowest rates of nearly 26%, but there is also a healthy probability (15%) of paying the highest rates.
The worst performing alternative is the simultaneous fixing of the four vessels on four-consecutive 5-year charters because of the probability of having a strong market when the four 5-year charters are renewed. This alternative is not only the most costly but carries the greatest risk of being greater than $2,500.
The mixed portfolio has a mean cost that is $54 higher than being in the spot market but where the risk of paying high rates has been reduced in half. The $54 can be viewed as an insurance premium to reduce the risk of paying high rates for shipping capacity by half.
Included in the model but not analyzed is ownership.
Ownership for an oil company has a higher charter rate in the early years until the company pays off the underlying debt and the equity has been retuned along with its return.
The primary reasons for this are higher crew costs and a higher return on the investment. After the debt and equity have been "paid off," the charter rate of the vessel is reduced to operating costs.
Whereas an oil company employing a series of 5-year charters may experience lower costs than ownership at all times, the oil company also foregoes the low charter rate of ownership once the debt and equity have been "paid off." This method can incorporate ownership along with chartering options.
If the model is set up for 30 years rather than 20 years, it is conceivable that ownership may give chartering a run for its money even though the owner's chartering rate is always initially lower than the cost of ownership.
The author
Roy L. Nersesian ([email protected]) is an associate professor at the school of business, Monmouth University, West Long Branch, NJ. He is also a marine consultant at Poten & Partners Inc., New York, and adjunct professor teaching maritime transportation and quantitative analysis at the Center for Energy and Maritime Transportation and Public Policy at the School of International and Public Affairs at Columbia University.
