Commonalities, uniqueness of oil as commodity explain crude oil, gasoline price behavior
Over the past year commodities in general, and metals in particular, have registered double-digit increases in dollar prices.
Oil has shared in the overall upward price movement. As with other commodities, world demand has been outpacing expectations, and available spare capacity has been declining sharply. In the case of crude oil, the limited spare capacity that exists is concentrated in a few Persian Gulf countries.
Within the US, gasoline is in the spotlight. While crude oil costs are a significant component of gasoline prices, this product has its own specific, commodity-like problems that have helped push prices up beyond increases in crude costs. In particular, high demand has run up against short-term supply constraints at a time when stocks, industry's cushion against supply-demand surprises, are exceptionally low.
This article focuses on the common elements of movements in oil and other commodity prices and then considers the special aspects of oil. We then turn to gasoline and especially the impact of newly implemented federal and state regulations on supply availability.
With minimal growth in refining capacity at home, the US looks to product imports to meet a growing share of its gasoline requirements.
There is evidence that, early in the year, regulatory requirements for gasoline inhibited the ability of foreign sources to meet them.
On the other hand, it appears that strong price incentives to date, plus resolution of "teething" problems, is leading to improved supply availability and, assuming no news surprises, the potential for less extreme prices.
Economic growth
As has happened before, global economic growth led by industrial output pushes up demand for commodities, narrows available spare capacity, and leads to escalating prices, particularly for industrial raw materials. A falling dollar adds another upward price influence.
Oil, the world's most prominent commodity, has been subject to these upward price influences for commodities. In common with other commodities, oil has become a favorite of investors looking for higher returns in the face of already high equity values and low interest rates.
Yet oil is different, at least some of the time. A highly visible producers' organization, the Organization of Petroleum Exporting Countries, has demonstrated a long-term, if uneven, ability to influence prices through its quota agreements.
Moreover, supply of this essential commodity is subject to significant risks of disruption, as developments over the past few years in Iraq and Venezuela have highlighted. With limited spare capacity and tight inventories, the mere threat of disruptions adds further upward pressure on prices.
Commodity price developments
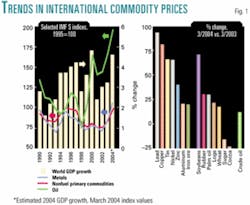
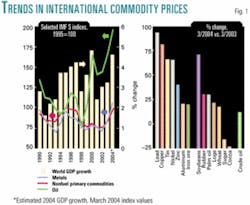
Fig. 1 shows, in the left panel, broad trends in commodity price movements, including oil, since 1990 and, on the right, changes over the 12 months through March of this year for a selection of commodities, again including oil.
As indicators of broad trends, the left panel shows the International Monetary Fund dollar price index for nonfuel primary commodities and, within that category, the IMF dollar price for metals. Also shown is the IMF index for oil prices, derived from the average of the spot prices for West Texas Intermediate, Brent, and Dubai crudes.
The indices all have a base value of 100 for 1995. Average annual values are shown for 1990 through 2003 and values as they stood in March 2004. The bars of the left panel show year-on-year world gross domestic product growth as calculated on a purchasing power parity basis by IMF, including estimated growth in 2004.1 The just-published estimate of 4.6% is significantly above IMF's estimate of 4.1% published in September 2003.
Three broad GDP growth cycles stand out: the 1990-95 growth slowdown and recovery following the first Iraq crisis, the growth setback from the 1998 international debt crisis and subsequent 1999-2000 recovery, and the 2001 growth slowdown exacerbated by the Sept. 11, 2001, terrorist attacks on the US followed by an initially slow—but still accelerating—recovery led by the two growth poles, the US and China.
Through the mid-1990s, the broad commodity indices and oil prices showed a roughly similar pattern, falling in the early 1990s and then strengthening in the mid-1990s as world economic growth accelerated. Oil's movements were somewhat stronger, primarily because prices had been pushed up in 1990 by the Iraqi invasion of Kuwait. In 1995, the oil price corresponding to the base index value of 100 was just over $17/bbl. At its 1996 peak for that cycle, the index value reached 118, or a price of about $20.40/bbl. All three indices fell sharply in 1998, the debt crisis year; but thereafter, oil moved off on a path of its own.
During 1998-2000, the oil price index more than doubled, (with the average composite price rising from about $13/bbl to about $28/bbl). The other indices behaved very differently. The overall index for nonfuel primary commodities declined by about 3% during the 2 years, weighed down by price declines for food and especially beverages.2 The more cyclically attuned metals index rose during the 2 years by 11%, a significant gain on its own terms but minimal compared with what happened with oil.
Recently, the three indices again have shown similarities. The March 2004 values shown are up vs. their 2003 averages by 21% for all nonfuel commodities, 36% for metals, and 17% for oil.
The right panel in Fig. 1 shows, for selected commodities included in the IMF indices, the price changes from March 2003 to March of this year. Among the metals group, lead, copper, tin, and nickel showed increases of more than 50%, while the other three show gains of 20-40%. Among the agricultural commodities, soybeans logged a spectacular increase, while rubber, palm oil, logs, and wheat showed respectable double-digit gains. But not all agricultural prices have strengthened. Sugar and cocoa registered double-digit declines.
Compared with these other commodities, the price increase for oil, up 11%, does not stand out.3 Commodity prices in general—although with some exceptions among the agricultural commodities—appear to have been influenced by accelerating economic growth, narrowing of spare capacity, and to a certain extent, since these are all dollar-based indices, the declining dollar. They also may have caught the fancy, at least temporarily, of investors looking to diversify from stocks and interest-bearing investments.
Commonalities, uniqueness of oil
While oil is, of course, a commodity and at times shows price movements similar to those of other cyclically sensitive prices, there is no denying that oil is different, both in its international and domestic political aspects, as well as, at times, in its very different price paths.
Of course a big obvious difference is the existence of OPEC, the international organization whose member countries "Ucoordinate their oil production policies in order to help stabilize the oil market and to help oil producers achieve a reasonable rate of return on their investments."4 But just how, when, and to what extent OPEC and its member countries actually impact oil prices is far less obvious.
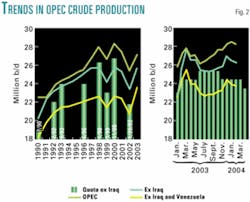
Fig. 2 illustrates trends in annual OPEC crude production in the left panel since 1990 and monthly on the right since January 2003. The chart shows production for OPEC as a whole, OPEC excluding Iraq, and OPEC excluding Iraq and Venezuela. OPEC decisions involve the setting of country "quotas," or agreed production levels.
These are shown for selected effective dates over the course of the 1990s through 2002, and then levels in effect by month since the beginning of 2003.
Oil vs. other commodities
From 1990 to 1998, total OPEC production rose to nearly 28 million b/d from 22.5 million b/d, a gain of nearly 25%. Virtually all the gains went to countries other than Iraq.5
Production among OPEC members excluding Iraq first expanded disproportionately to compensate from the withdrawal of nearly all of Iraqi production from the world market with growth slowing after 1995 as Iraq began a return to market under United Nations supervision. In July 1990, on the eve of the Iraqi invasion of Kuwait, a quota agreement came into effect calling for a total production level of about 22 million b/d, of which 19 million b/d was assigned to members other than Iraq. The quota for OPEC excluding Iraq was raised over the next few years, where it remained through 1997, then reaching nearly 24 million b/d in February 2003. Until the February 2003 increase, OPEC production excluding Iraq generally exceeded the quota for the group, a condition that had reappeared after 1993. The years immediately following the first Iraq war through 1998 was the period when oil prices overall moved more or less in line with the other broad commodity price indices, suggesting that OPEC was basically following the market, exercising little active control over prices (or adherence to official quotas) over this timeframe.
In 1998, still higher OPEC production confronted the international debt crisis and economic slowdown that resulted in a price collapse that, in relative terms, exceeded what happened to other commodities.6
In March 1999, the OPEC countries agreed on a quota reduction (excluding Iraq) of about 3 million b/d. Although the actual reduction was somewhat less—and from a higher level—the reduction, combined with a pick-up in economic activity, was sufficient to push prices up beyond pre-1998 levels. In effect, in the face of a near-disastrous erosion of revenues, the organization did coalesce sufficiently to take significant volume oil off a glutted market and raise prices.
The year 1998 marks a break in what had been an upward trend in OPEC production. Since that year, production has fluctuated but rarely gone beyond the 1998 level. At first glance, this might suggest a sea change in OPEC behavior, in particular, greater cohesion and aggressiveness in limiting production and propping up prices.
But, although not obvious from the overall production profile, this has been a period of great stress and challenges within OPEC. Since 1997, OPEC has had to cope with the return of significant, and volatile, volumes of Iraqi production; growth in production elsewhere, especially the sharp recovery of oil supplies from Russia; and the falloff in demand growth in the aftermath of the Sept. 11, 2001, attacks—all negative elements for prices, especially in 2001 through most of 2002.
Toward the end of 2002, the oil market environment changed radically. Instead of attempting to manage production in the face of minimal growth in demand for its oil, its capability to produce was suddenly reduced by political turmoil in Venezuela, while the build-up to the Iraq conflict meant a potential, and soon actual, loss of supply from that country.
As shown in Fig. 2's left panel, in the first 3 months of 2003, production by OPEC members apart from Iraq and Venezuela moved up sharply to levels well above annual average levels for 1990-2003. Since that time, although they have fallen back from their March peak, they remain at historically high levels. Total OPEC production, including Iraq, has been averaging above 28 million b/d into early 2004, well above year-earlier levels, thanks in part to the (still incomplete) recovery of Venezuelan production and continued high production by the other members.
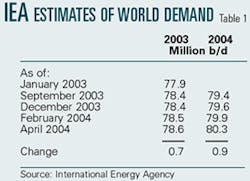
While 8 of the 11 OPEC countries (excluding Iraq) were producing at capacity, estimates of world oil demand have been creeping up. Table 1 summarizes the evolving estimates of world demand as published by the International Energy Agency. The IEA estimate of last year's demand has itself moved up. In January 2003, IEA estimated demand for that year at 77.9 million b/d. By its most recent April outlook, the estimate for last year had grown by 700,000 b/d.
Estimates for this year's demand also have moved up from earlier estimates. In its September outlook, IEA estimated 2004 demand at 79.4 million b/d. By April of this year, estimated demand was up by 900,000 b/d to 80.3 million b/d.
While demand estimates have moved up, IEA estimates of non-OPEC supply have not, meaning that the unexpected demand growth is to be met through drawdowns and smaller builds in already low stocks and/or higher OPEC production.
Capacity issues
Higher-than-anticipated demand for oil has been pressing against limited OPEC capacity, especially in the first few months of the year, putting upward pressure on prices apart from any official OPEC agreements regarding quotas.
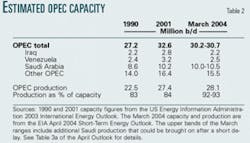
Table 2 shows OPEC capacity details for 1990, 2001, and the March 2004 estimate, just released by the US Department of Energy. The bottom of the table shows production for the same periods and the comparison between production and capacity.
In 2001, estimated OPEC capacity stood at 32.6 million b/d, nearly 5.5 million b/d above the 1990 figure. Among the countries showing higher levels were Iraq, Venezuela, and Saudi Arabia, which together accounted for just over half the total increase. The latest estimate, for March 2004, shows total capacity down by 2-2.5 million b/d from the 2001 level. Reductions in estimated capacity for Iraq and Venezuela account for over half of the total decline.
While estimated Saudi capacity was unchanged, the other members of OPEC showed a collective decline of 900,000 b/d.7 Part of the overall decline in capacity is clearly related to geopolitical developments, as in the case of Iraq, and internal political problems, as in the case of Venezuela, which have discouraged new investment and hampered ongoing maintenance. Another consideration is that with OPEC production more or less stagnant in recent years, the rationale for investment in new capacity was less compelling.
In 1990 and 2001, OPEC production as a percent of capacity was about the same, 83% and 84%, respectively. In March 2004, the percentage was much higher, 93%, thanks to the combination of higher demand and lower capacity available to meet it. In this respect, the physical supply-demand conditions for oil resembled what was happening to commodities in general and produced a similar result, namely higher prices.
In one respect, the current market is even tighter than indicated by the overall capacity figures. The world is looking for light, low-sulfur crudes, the most suitable for producing gasoline, especially gasoline that meets the new, more-stringent sulfur specifications discussed in the following section. But existing spare capacity is concentrated in the heavier, higher-sulfur crudes and in countries farther away from Atlantic Basin markets, further stretching out the supply chain. This has put added upward pressure on short-haul, high-quality crudes such as WTI.
What about gasoline?
Higher prices for crude oil mean increased costs of producing gasoline. But gasoline prices are influenced not simply by fluctuations in crude costs but also by specific supply-demand conditions associated with the product.
Early last year, and even more so this year, gasoline has experienced supply constraints that have pushed up prices significantly beyond the cost of crude. In the first quarter of this year, spot gasoline prices, as measured by the New York Harbor price for 87 octane unleaded, averaged about 20¢/gal above the crude (WTI) price. The differential was significantly above the 13¢/gal differential in first quarter 2003 and far above the 8¢/gal differential for the same period in 2002.
As in the case of crude, surprisingly strong demand has been pressing against capacity, although for gasoline this year, the capacity limitations have been aggravated by regulatory actions.
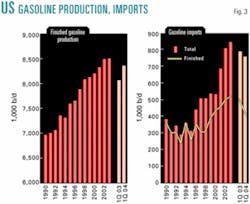
Fig. 3 shows trends in US finished gasoline production and gasoline imports from 1990 through 1993 and the first quarters of 2003 and 2004.
From 1990 to 2003, US finished gasoline production rose by about 1.5 million b/d but experienced a slowdown in growth in the later years. In 2003, gasoline production was about flat vs. 2002. At first glance, higher production in the first quarter of this year vs. last suggests a significant improvement, but as will be discussed momentarily, part of the gain is statistical.
Total gasoline imports, shown by the bars in Fig. 3's right panel, were relatively flat in the early 1990s but since have surged, growing from just over 300,000 b/d in 1995 to 800,000 b/d in 2002 and nearly 850,000 b/d in 2003. From 2000 to 2003, the growth in imports was about the same as the increase in domestic production, with both up just over 300,000 b/d, suggesting that at the margin foreign suppliers are playing just as important a role as domestic sources.
The total gasoline figures include both finished gasoline and blending components. The graph line in the right panel shows finished gasoline imports, which through the first half of the 1990s accounted for nearly all of the total.
Since then, blending components have become increasingly important, especially since 2000. These go into the production of finished gasoline, in this case through blending with other additives as opposed to running crude. From 2000 to 2003, the increase in imports of blending components amounted to nearly three fourths of the increase in production of finished gasoline.
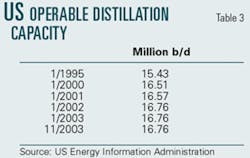
The growing reliance on product imports is linked to the slowdown in growth of domestic refining capacity. As shown in Table 3, US refining capacity grew by about 1 million b/d from 1995 to 2000 but has been virtually flat ever since. Indeed, figures for late 2003 indicate no growth at all since the beginning of 2002. In first quarter 2004, total imports were down by about 4% vs. first quarter 2003.
There was a large shift in composition between this year and last. In the first quarter of this year, imports of finished gasoline were running about 100,000 b/d below year-earlier levels, while blending component imports were up by nearly 70,000 b/d.
Newly implemented regulations played the key role in these changes. The bans on methyl tertiary butyl ether that came into effect in California, New York, and Connecticut at the beginning of this year restricted the market for MTBE-based finished gasoline imports while creating a market for imports of RBOB (reformulated gasoline blendstock for oxygenate blending) that could be blended locally with ethanol.
However, the decline in finished gasoline imports was significantly greater than the rise in blending components—and at a time when prices were signaling that more was wanted. Here, another regulatory program, the tightening of sulfur specifications that took effect this year, played a small but important role, at least in the early part of the year.
As of Jan. 1 of this year, refiners and importers (apart from small refiners subject to transition provisions) are subject to a corporate pool average maximum standard of 120 ppm of sulfur, a substantial reduction from prior-year average sulfur levels of 300 ppm. This need to reduce overall sulfur levels means less acceptability of foreign-source, high-sulfur gasoline. Data for early this year show a sharp fall-off in imports from certain countries, particularly in Latin America, where sulfur levels are far above the new standard. Given time, and the incentives created by high margins, these supply limitations can be overcome, and indeed there is strong evidence the process is already under way as other sources of supply are tapped to take advantage of the opportunities.
However, the process involves looking further afield and bringing supplies from more distant sources—and therefore takes time and involves somewhat higher costs, particularly in light of sharp increases in tanker rates.
Conditions with respect to inventories and spare capacity are exceptionally tight, but it should be kept in mind that for oil, as with other commodities, there is an ongoing tendency to hold lower inventories and avoid excess capacity, thereby reducing industry costs.
For consumers, these cost savings have for the most part been passed through in lower prices. However, there is a trade-off. Inventories and spare capacity are two cushions against supply-demand "surprises," and their decline means greater reliance on price movements to correct imbalances.
In effect, price volatility has become the norm rather than the aberration. As for gasoline, with refining capacity flat, rising imports are required to meet growth in demand.
It thus becomes increasingly important that regulatory actions to change product quality be sensitive to the ability of foreign markets to meet these changes in a timely fashion. Given strong enough incentives and time to respond, foreign markets can meet almost any US product specifications.
But even temporarily getting ahead of the international market's ability to supply the more-stringent product can put upward pressure on prices to US consumers apart from any developments in the crude oil market. F
References
1. In general, world GDP growth on a market exchange rate basis tends to be about a percentage point less, due primarily to the much lower GDP weight assigned to China when market exchange rates are used.
2. The IMF index of prices for food (cereals, vegetable oils, protein meals, meats, seafood, sugar, bananas, and oranges) fell by about 10%. The price index for beverages (coffee, cocoa, and tea) showed a drastic decline of 33%.
3. Oil prices were rising in the approach to the Iraq war, so the March vs. March comparison may look exceptionally low. Nonetheless, eliminating this factor does not change the conclusion that oil lately has been behaving more or less in line with other commodities. Comparing March 2004 with September 2003, well after any war risk premium had dissipated, shows a price gain for oil of 25% vs. a gain in the IMF metals index of 36% and a gain in the nonfuels index of 20%.
4. From the functions of OPEC as described on that organization's web site at www.opec.org.
5. Saudi Arabia, the country with the largest immediate spare production capability, showed the largest individual country gains with production rising from an average of 6.4 million b/d in 1990 to just over 8 million b/d in 1991, a level it more or less maintained during 1991-98.
6. In October 1997, the average price of oil as calculated by the IMF stood at just above $20/bbl. At the end of 1998, the price had fallen to $10.41/bbl. Successful OPEC action to cut production pushed up prices by the end of the following year to $25/bbl.
7. Among the other OPEC members, Indonesia shows a significant markdown in estimated capacity, from 1.5 million b/d in 2001 to 1 million b/d in March 2004. Algerian capacity was down by 400,000 b/d.
The authors
John H. Lichtblau is chairman and CEO of Petroleum Industry Research Foundation Inc. (PIRINC). He headed PIRINC as executive director during 1961-90. Lichtblau has served since 1968 on the National Petroleum Council, an industry advisory group appointed by the US Secretary of Energy, and is a member of the Council on Foreign Relations. He also is chairman of PIRA Energy Group. A leading international expert on the petroleum industry and petroleum economics, he has authored a number of publications, has been a frequent witness at congressional hearings on energy policy, and a keynote speaker and lecturer at conferences and seminars. Lichtblau performed his undergraduate work at the City College of New York and graduate study at New York University.
Larry Goldstein is president of PIRA Energy Group and president of PIRINC. He has been a member of the Petroleum Advisory Committee of the New York Mercantile Exchange and a contributor to studies by the National Petroleum Council. He also has served as treasurer of the Scientists Institute for Public Information.
Ronald B. Gold is an energy economist, vice-president of PIRINC, and a consulting senior advisor to the PIRA Energy Group, where he writes on oil industry issues and environmental concerns. He is a principal author of most of PIRINC's research reports and directs PIRA's Emissions Market Intelligence Service. Gold retired at the end of 1997 from Exxon Corp. where he was company economist and manager of the Energy Outlook Division for Exxon Co. International. Earlier in his career, he worked for the US Department of the Treasury and Office of Tax Analysis and was an assistant professor of economics at Ohio State University. Gold received his undergraduate degree from Brooklyn College, City University of New York, and his MA and PhD in economics from Princeton University.
PIRINC's research reports and directs PIRA's Emissions Market Intelligence Service. Gold retired at the end of 1997 from Exxon Corp. where he was company economist and manager of the Energy Outlook Division for Exxon Co. International. Earlier in his career, he worked for the US Department of the Treasury and Office of Tax Analysis and was an assistant professor of economics at Ohio State University. Gold received his undergraduate degree from Brooklyn College, City University of New York, and his MA and PhD in economics from Princeton University.
