Using interwell chemical tracers and the coherence cube to understand reservoir communication
Interwell chemical tracers are used as a tool to help understand a reservoir in a quantitative way.
An interwell tracer program provides the direction of fluid movement from a particular injector to an offset producer and its rate of movement. This information supplements the traditional studies including geophysics, well logging, and well testing used to define reservoirs and their heterogeneities.
The comparative higher costs of enhanced oil recovery processes put greater emphasis on the need for a detailed description of the reservoir to be exploited and hence the need for tracer programs.
Though useful, tracers do not furnish detail on the actual pathways followed by the fluid. This information can be provided by 3D seismic data that are transformed into high resolution coherence coefficients for the purpose. These coherence volumes indicate possible pathways that could be followed by the tracer fluids and hence the flow direction.
This attempted application of the 3D coherence data to help explain interwell tracer data is the first of its kind.
Introduction
An understanding of reservoir heterogeneity is crucial in the design and operation of secondary/tertiary recovery projects. During injection operations, the injected fluids (gas, liquid, foam, gel, etc.) will flow preferentially into high permeability intervals and fractures. Interwell tracers provide the only direct means of tracking fluid movement in a reservoir, thereby allowing the determination of these reservoir heterogeneities. Once these heterogeneities have been identified, the design and operation of any injection project can be modified to optimize injection and/or sweep efficiency, thereby improving hydrocarbon recovery.
Coherence technology is utilized in surface seismic data interpretation to see faults and stratigraphic anomalies clearly. Because of its high spatial resolution, the coherence volume permits extraction of subtle stratigraphic detail and improvement in accuracy that helps in interpretation.
This article endeavors to demonstrate the potential value in combining these two distinct and separate technologies to help in understanding preferential flow in reservoirs. To our knowledge, 3D seismic data have never been used to explain the results obtained from tracer programs and so is the motivation for this article.
We begin with a review of chemical interwell tracers, followed by a description of our coherence imaging. We then apply these two technologies to a field study run in southern Alberta. We conclude by showing that the tracer data measurements indicate that low coherence features appear to be related with permeable fractures and so help in understanding reservoir communication.
Chemical interwell tracers
Tracer technology has been used for several decades as a tool for characterizing geological formations.1 2
A tracer is a substance, chemical or radioactive, that allows tracking of fluid flow through porous subsurface intervals. A substance needs to have specific properties to qualify it as a tracer, and some of these properties are:
1. It does not react with the formation, completion or tubulars.
2. Its concentration in the reservoir fluids is insignificant.
3. It exhibits no hold up in the reservoir (does not lag the injected fluid).
4. It is stable at injection and production conditions.
5. It can be detected at extremely low concentrations (50 parts per trillion).
6. It is environmentally safe.
7. It has an acceptable price tag.
Mixed with the transporting fluid in the right concentration and quantity, the tracer is injected into the formation of interest through a well (injector). Once in the formation, the tracer along with the fluid travels laterally and can be detected in other neighboring wells.
The time needed for the tracer to traverse a certain distance, i.e. from the injection point to the extraction or detection point, is referred to as the transit or breakthrough time.
While permeable homogeneous formations will allow quick passage to tracers, heterogeneities in the formations would impede their flow. Consequently, the breakthrough times can be used to characterize different formations in terms of fluid movement.
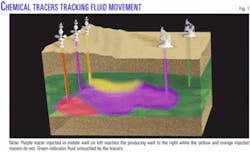
Once fluid flow is determined within the reservoir from tracer results, it helps in the understanding of flow paths in the reservoir (Fig. 1). This is important for enhancing oil production levels and eventually getting higher ultimate recovery from the oil fields.
The use of chemical interwell tracers is beneficial in that it provides the only direct means of tracking fluid movement in a reservoir, thus allowing the determination of reservoir heterogeneity. Chemical tracers allow for the determination of the magnitude of any flow, whether it is radial or unidirectional flow, in the reservoir formation. In this way, not only the communication between the injector(s) and the producer wells is established but also the extent of the communication.
Carefully designed and executed interwell tracer programs make it is possible with varying degrees to:
- Delineate flow barriers and boundaries.
- Identify directional flow paths and reservoir heterogeneity.
- Quantify the causes of early water breakthrough (problem injectors and/or problem producers).
- Identify dual or multiple porosity/permeability systems and their respective fractional volumes.
- Evaluate volumetric sweep efficiency and percentage of tracer recovered for each injector at each producer.
- Measure the relative in situ velocities of injected fluids.
- Improve the design and implementation of secondary and tertiary recovery projects.
Although useful, this method gives information on the point-to-point 'continuity' and does not yield the actual pathways followed by the fluids. This information is usually crucial for the understanding of fluid flow in formations that contain flow barriers, low permeability pockets or lateral variation in porosity within the formations.
Obviously, seismic data possibly provides another way of achieving this. However, the resolution of seismic data is usually too low to see any meaningful detail that would help explain the fluid flows. A coherence volume offers a higher spatial resolution and so could be considered for this purpose.
Coherence cube imaging
A coherence cube is essentially a volume of coherence values generated from the input 3D seismic data volume using some statistical measure.
Coherence measurements in three dimensions represent the trace-to-trace similarity and therefore produce interpretable changes.3-6 Similar traces mapped with high coherence coefficients and discontinuities have low coefficients. Regions of similar traces cut by faults, for example, result in sharp discontinuities of trace-to-trace coherence, producing delineation of low coherence along fault planes. Since the three-dimensionality is an essential ingredient of coherence computation, faults or fractures in any orientation are revealed equally well.
Figs. 2a and 2b depict an example where faults, apparently difficult to interpret on the seismic slice, show up clearly on the coherence slice. Stratigraphic features generate similar discontinuities, resulting in sharp detection of reef and channel boundaries and deltaic sediments. Consequently, in addition to faults, channels, and beaches, coherence cube has been successfully used for easy visualization of mud volcanoes, mass wasting, dewatering features, and other features.
An attractive characteristic of coherence volume is that it gives an unbiased view of the features in the seismic volume. No interpretation is required for viewing them.
Sharpened coherence cube
It is possible to apply edge enhancement operators to the coherence volume4 7 and get a 3D cube of sharpened coherence coefficients.
Comparison of the same set of slices from the coherence and sharpened coherence volumes shows the crisper appearance of different features on the latter, which prove to be helpful in interpretation. Fig. 2c shows the sharpened coherence slice. Evidently, sharp and accurate detail is visible on this slice.
Since the coherence volume offers a much higher lateral resolution, it would afford a more accurate way of detecting discontinuities which may then accordingly be interpreted as flow barriers or possible fluid flow pathways and/or barriers within producing reservoir formations.
In the application described below, appropriately, the original seismic data was reprocessed, augmented with a frequency enhancement technique and submitted to generation of a sharpened coherence cube.
Producing field application
In the southern Alberta field under study, the discovery well was drilled in 1993 and production began in 1994.
More than 20 wells have been drilled in the pool. The production, which peaked at 1,200 cu m/day (7,500 b/d) of oil in 1996, had dropped to 400 cu m/day (2,500 b/d). The reservoir is a Devonian Lower Nisku dolomite formation, about 35 m (115 ft) thick. It was deposited as a widespread carbonate bank in a shallow, open marine environment. The porosity is primarily vuggy within the oil reservoir but ranges to intergranular beyond.
Overlying the Nisku reservoir rock are the primary dolostones and the laminated impermeable anhydrites formed in the subtidal to supratidal environment of a regressive, often hypersaline shelf.
Below the Nisku are the Ireton and Leduc formations. The Ireton, an argillaceous dolomite, is very thin in the area. It is underlain by thick porous Leduc dolomite, which is generally regarded as a regional aquifer.
There is no "waterflood pattern" in this field as the six injection wells are in the western and central portions of the field and the majority of the active producers are in the eastern and southern areas of the field. The field has 24 active producing wells. The total field water injection into the Nisku formation averages 3,200 cu m/day (20,134 b/d) through five injection wells.
The available 3D seismic data were reprocessed. The processing flow was aimed at improving the quality of the poststack data to gain higher resolution and better S/N ratio in the target interval. Prestack migration and surface consistent deconvolution helped to achieve this objective.
The frequency bandwidth of the stacked data was enhanced by taking advantage of the higher resolution of the VSP data. The method, called High Frequency Restoration (HFR), utilizes the frequency decay experienced at different VSP depth levels in a well.8 Seismic data after HFR have an effect similar to a time-variant attenuation correction, resulting in a compression of the embedded wavelet.
The frequency enhancement of the seismic data was evaluated by matching it with the VSP corridor stack before and after HFR and also by running coherence cubes. Fig. 3 shows the slices from the coherence volumes run on data before and after HFR, depicting more distinct patterns yielding a clearer image for interpretation.
There is a clear NW-SE fault and fracture trend apart from another NE-SW trend (Fig. 3b, not so obvious in Fig. 3a. The E-W lineations seen in Fig. 3b could be associated with the acquisition footprint, being the direction of receiver lines. This effect, however, is feeble and does not pose a problem.
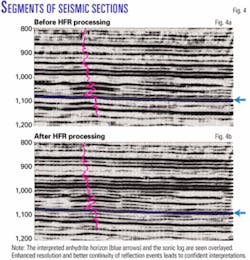
Fig. 4 shows a segment of the seismic section without and with high frequency restoration. Notice the improvement in the resolution; reflection events now exhibit more continuity.
Tracer analysis results
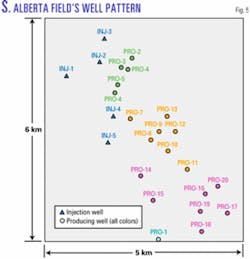
Wells INJ-1 to INJ-5 are the five injection wells (Fig. 5).
Vertical njector wells INJ-1, INJ-2, and INJ-3 to the northwest portion of the field showed no pressure maintenance support for the producers to the south. The chemical tracers injected into these three wells did not appear in any of the produced wells in the main producing pool to the south. This indicates some sort of flow boundary or barrier between these three injection wells and the producing area to the south.
The chemical tracer injected into vertical well INJ-5 showed low but general response throughout most of the field to the majority of the producers (not shown in Fig. 5). In contrast, the chemical tracer injected in horizontal well INJ-4 showed significant and varied response within the field and has been identified in the produced water samples analyzed.
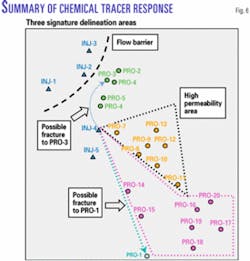
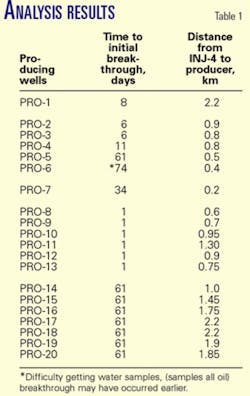
The tracer injected in INJ-4 injector, shows medium to strong response over the entire field. Table 1 indicates the tabular results of the sample analysis. Fig. 6 indicates graphically the tracer breakthrough response seen from the most significant INJ-4 giving pressure support to the field, where 56% of the chemical tracer from this one injector was recovered whereas a smaller amount of support was seen from vertical INJ-5 where 10% of the chemical tracer injected was recovered.
Observations
The tracers injected in the northwestern part of the field (Fig. 6, vertical wells INJ-1, INJ-2, and INJ-3, color-coded blue) were not detected in any of the producers after 2 years. This suggests a flow barrier between the three injectors in the north end of the field and the producers to the south.
Tracers injected in well INJ-4 (blue) reach well PRO-1 (light blue to the south), a distance of just over 2 km, in 8 days. Wells closer than PRO-1 and wells to the east (shown in pink) took 61 days to reach breakthrough.
Tracers injected in well INJ-4 (blue) reach wells in the northeast. Tracer reached well PRO-3 (green) faster than any of the closer wells PRO-4 (green) or PRO-5 (green) and PRO-6 (green) wells.
Tracers injected in well INJ-4 (blue) reach the wells in the cluster (brown) to its right (east) so fast (1 day) that there seems to be a high permeability pathway leading from this injector to the wells in this area.
Coherence explanations
It is reasonable to expect fracturing in carbonate reservoirs that because of their complex depositional facies and diagenetic effects make characterization of such reservoirs a challenge.
While such factors affect trapping and production of hydrocarbons, they also affect the reflectivity detail recorded by seismic data. Localized variations in character of subsurface reflectivity are manifest as frequency and phase changes on seismic traces, which are picked up well with sharpened coherence algorithms.
The horizon corresponding to the anhydrite top, above the reservoir, was picked. Horizon slices were produced from the sharpened coherence volume at levels just below the reservoir formation (Fig. 7). This is because it was believed that the fluid flow in the reservoir is probably due to faults and fracture trends at its base.
Fig. 7b shows the horizon slice from the sharpened coherence cube and may be compared with the seismic horizon slice (Fig. 7a to examine the extra reflection detail that is evident.
As seen in Fig. 7b, wells INJ-1, INJ-2, and INJ-3 are seen located on the northwest side of an almost NE-SW linear trend seen in the upper left corner. This trend is interpreted as a flow barrier that prevents the tracers injected in the three wells to travel through it.
One notices a pixel-effect on the coherence images shown. This is due to the fact that a small portion of the coherence volume (30 sq km) has been scooped out of the bigger 3D volume, which is more than three times this size.
The tracer injected in well INJ-4 reaches well PRO-1 (indicated with arrow) in just 8 days. Obviously, one would expect this to take place via faults and fractures at this level. Fig. 7b shows a fracture mesh of low coherence, which may be interpreted as being responsible for this tracer flow. However, the seismic data in this part of the survey has a somewhat lower signal-to-noise ratio.
This aspect of the data, though valid, brings in an element of uncertainty and demerits the above interpretation. Nevertheless, Fig. 7 offers an explanation for the observation of tracers injected in INJ-4 and detected in PRO-1.
Fig. 8 shows the horizon slice at 66 ms below the tracked horizon. The tracer injected in INJ-4 is detected in wells PRO-3 and PRO-2 after 3 days and in well PRO-4 after 27 days. Examining the coherence slices in Fig. 8, one notices a low coherence pathway for the tracer to follow starting from well INJ-4 and traveling to wells PRO-3 and PRO-2.
Well PRO-4 is located away from this low coherence pathway and so takes a longer time. The circular feature seen to the top right is a sink hole caused either by dissolution of limestone at the surface or collapse of a cave. This one has circular map pattern where the fill nears the tuning thickness. Coherence is detecting the edge of that reflection.
Fig. 9 shows a horizon slice at 70 ms below the horizon. The tracer from well INJ-4 reaches the wells in the pocket marked in red in virtually no time (1 day). This observation is not surprising as the marked pocket has a mesh of criss-crossing low coherence lineations which may be interpreted as fractures that could provide high permeability pathways for fluid movement and so the reservoir formation has high connectivity. It was expected that this pocket has high permeability and so the reservoir formation has high connectivity.
What was learned
Tracer results were able to depict flow boundaries, directional flow, problem injectors and producers, and heterogeneity of the field within the reservoir into three distinct areas. However, tracers did not show the flow path of the fluid movement.
Sharpened coherence volumes were generated for the reprocessed 3D volume for a producing field and horizon slices just below the reservoir level interpreted to understand the interwell tracer observations.
Discontinuities in the area and zone of interest were interpreted as flow barrier and/or flow pathways. These slices offer an explanation for the tracer results.
An important conclusion drawn from this exercise is that there is potential value in combining two distinct and separate technologies, viz. coherence and interwell chemical tracers, to understand reservoir communication. Needless to say, the success of such an endeavor would depend to a large extent on the quality of the seismic data being used.
Acknowledgments
The authors acknowledge useful discussions held with Vasudhaven Sudhakar, vice-president, Core Laboratories Reservoir Technologies Division, Calgary, and the assistance of Mike Holmgren, ProTechnics manager of reservoir engineering, Houston. The authors also thank Core Laboratories for allowing us to publish this article. Coherence cube is a trademark of Core Laboratories, and HFR is a trademark of Paradigm Geophysical.
References
1. Brigham, W.E., and Dehghani, M.A., "Tracer testing for reservoir description," SPE 14102, 1987.
2. Al Dolaimi, A.M., Berta, D., Dempsey, M.J., and Smith, P.J., "Evaluating tracer response of waterflood five-spot pilot: Dukhan field, Qatar," SPE Paper 17989, 1989.
3. Bahorich, M., and Farmer, S., "The Coherence Cube," The Leading Edge, Vol. 14, No. 10, 1995, pp. 1,053-58.
4. Chopra, S., "Coherence Cube and Beyond," First Break, January 2002, pp. 27-33.
5. Marfurt, K.J., Kirlin, R.J., Farmer, S.L., and Bahorich, M.S., "3-D seismic attributes using a semblance-based coherency algorithm," Geophysics, Vol. 63, No. 4, 1998, pp. 1,150-65.
6. Marfurt, K.J., Sudhakar, V., Gersztenkorn, N.A., Crawford, K.D., and Nissen, S.E., "Coherency calculations in the presence of structural dip," Geophysics, Vol. 64, No. 1, 1999, pp. 104-111.
7. Chopra, S., and Sudhakar, V, "Fault interpretation—the coherence cube and beyond," OGJ, July 31, 2000, pp. 71-74.
8. Chopra, S., Alexeev, V., and Sudhakar, V., "High frequency restoration of surface seismic data," The Leading Edge, Vol. 22, No. 10, 2003.
The authors
Satinder Chopra (schopra@ paradigmgeo.com) began his geophysics career in 1984 with India's state Oil & Natural Gas Corp. He joined CTC Pulsonic, Calgary, as senior geophysicist in 1998 and is presently manager, special projects with Paradigm Geophysical. His interests are in the fields of seismic & VSP processing and interpretation, specializing in coherence imaging, inversion, and AVO analysis. He has MSc and MPhil degrees in physics from Himachal Pradesh University.
Ian M. McConnell is country manager-Canada for ProTechnics Division of Core Laboratories Canada Ltd. for 6 years. Before this he worked 2 years for a private chemical and tool company in Calgary, Houston, and Venezuela, following 18 years for Nowsco Well Service Ltd. with varying responsibilities in operations, engineering, and sales in different locations in Canada, the US, North Africa, Europe, and the Middle East. He holds a BSc adv. degree from the University of Saskatchewan and a resources diploma from Saskatchewan Institute of Applied Arts and Sciences (now Kelsey Institute).

