Optical technology improves batch cutting, quality determination
Operating experience on an 800-mile products pipeline in China suggests that optical technology may not only be used to improve batch cutting, reduce "transmix" (mixture of products in transit), and reduce the downgrading of product quality, but also for online quality determination and monitoring.
Colonial Pipeline Co., Atlanta, assisted PetroChina Co. Ltd. in use of this is relatively new technology.
Optical technology
The 800-mile, 20-in. LanZhou-ChengDo-ChongQing products pipeline contains 15 stations including tank farms, and booster, delivery, and pressure-reduction stations. Elevations range from 400 m (1,300 ft) to as high as 2,450 m with maximum operating pressure as high as 14 MPa (about 2,000 psi).
This state-of-the-art pipeline uses real-time leak detection, batch tracking, and metering software as well as offline pipeline simulation that was commissioned in September 2002. This system is controlled by the ChengDo control center with very small aperture satellite (VSAT) communications of less than 1-sec response time, and direct-dial-network backup communications.
PetroChina used a Kam Controls Inc. optical interface detector on this system to improve product batch cutting because it detects interfaces between such products as gasoline and oil, premium gasoline, and regular gasoline.
Pipeline operations and control centers use optical interface detection (OID) signatures combined with density signatures and batch tracking, using volume to estimate interface arrival, to improve valve switch timing, which affects product quality.
As a change in product approaches a delivery location on a pipeline, the operator monitors density and optical signatures to determine when valve changes should occur. This process allows the operator to make valve changes (switches) in a planned manner at the beginning of an interface between products, in the middle of the interface, or at the end of the interface to protect one product from another.
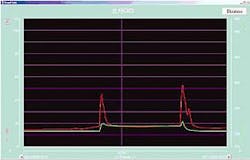
This graphic represents a typical batch change between 90 grade, 93 grade, and 90-grade gasoline batches (Fig. 1).
Pipeline systems can use this information to make decisions that reduce transmix volumes and product downgrades, improving overall product quality while affording substantial economic benefits.
Fig. 1 represents a typical batch change between three grades of gasoline.
Applications
When product changes enter the pipeline from a tank farm or refinery, the control center computer captures the original signature of the product change and interface. The control center operator can then compare this signature at subsequent locations down the pipeline when making such critical decisions as product delivery switches and judge the timing of these decisions to optimize operations and product quality.
Comparing signatures from upstream stations to downstream stations can also give a control center operator an idea of how the interface between two products is changing. For example, if a pipeline is shutdown, sometimes the interface will expand. Optical technology will identify this change in the interface. This valuable information improves decision-making.
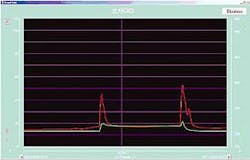
These are Oct. 16, 2003, OID and density readings at the ChengDo station (Fig. 2).
An outstation is a location separate from the receiving facility, perhaps several miles upstream of the location, which has instrumentation (i.e., an OID and densitometer). Outstations occur at critical locations (end points and critical midpoints) or when the distance between delivery locations is significant and typically are about 1 hr upstream of the delivery location, based on flow rate.
At these locations, an optical analyzer and densitometer are mounted in a "fast loop" configuration and the data are transmitted via a programmable logic controller (PLC) to the supervisory control and data acquisition (SCADA) system and then to the control center or the station downstream of the outstation. The signature from the outstation assists in the downstream delivery station switches.
Lan Cheng Yu pipeline
In an effort to reduce transmix, Petro China installed several OIDs on its Lan Cheng Yu pipeline. The company wanted to improve batch cutting overall but specifically wanted to identify changes between gasolines having the same density (90 and 93 grades, for example).
Additionally, the Lan Cheng Yu system has been experiencing increased demand and will move jet fuel next year, which further increases the need for precision batch cuts.
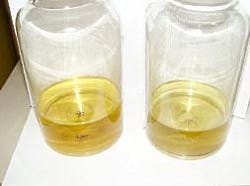
Samples show particulates after about 2 hr (Fig. 3).
Over several weeks, the company monitored the optical batch-cut signature to determine the effectiveness of optical technology. The system allows the controller to view volume, gravity, and optical signatures on the same screen.
Several interesting findings emerged.
First, the optical interface effectively detected the batch change. PetroChina controllers, however, noticed that the signal after the batch change was "fuzzy," gradually increasing or decreasing for no apparent reason. This trend also seemed to be more pronounced as the interface moved down the line (Fig. 2).
Instrument drift and calibration were checked several times; no instrumentation problems were detected. Checks were also made on the signal cables grounding to eliminate electrical interference in the field.
PetroChina contacted Colonial Pipeline for assistance because the company has extensive experience with optical technology, using it for the same batch-cutting precision that PetroChina was working to achieve
Initial efforts between the companies to develop several tests to identify the causes of the "fuzzy" signal proved unsuccessful. Colonial then sent a representative to China to assist PetroChina in a cooperative attempt to solve the problem.
Test method
The first structured testing method was developed to try to isolate the problem being encountered.
Initially the upstream station OID was calibrated to match the ChengDo station OID. This strategy seemed to improve the readings, but subsequent checks indicated that the problem continued.
The next step was to determine if the problem was site specific. At the ChengDo station, product samples were pulled from the pipeline and checked against a lab OID, which was calibrated to the standard established earlier for PetroChina products. Lab results matched those of the installed online OID.
The team continued to pull periodic samples to determine if the control center readings matched the field device and the lab device. All readings matched.
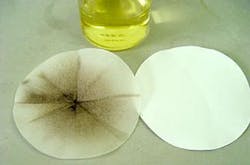
After about 2 hr, one of the engineers noticed a residue beginning to form on the bottom of a sample beaker glass. After a period of several hours, additional readings and samples revealed that particulate residue was beginning to form in all sample containers (Fig. 3).
The team decided to analyze the impact of the particulate found in the sample beakers.
First an initial sample OID reading was taken from the pipeline and a physical sample was pulled. The next step was to take an OID reading of the physical sample in the lab.
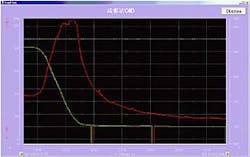
The sample was filtered with laboratory filter paper and a second OID reading was taken in the lab (Fig. 3).
Filter paper shows particulate filtered from sample (Fig. 4).
Findings; solution
After filtering, the OID readings of the sample were found to be significantly lower. PetroChina determined that this residue was fine rust and silt from the original installation of the line.
The company then determined that when the pipeline was periodically shut down, this particulate would drop out of suspension in the fluid and lie in the pipeline. Once the line was restarted, the fluid would gradually pick up more and more of these particles.
The OID responded to the particulate in the product, giving the "fuzzy" reading that would increase or decrease over time depending on the characteristic of the flow rate, varying the amount of particulate in the fluid.
Now that PetroChina understands the nature of the problem, more frequent pigging is being implemented.
It is important to note that the optical analyzer is effective in determining the interface even with the particulate in solution, but greater understanding of the underlying cause of the signature characteristic has been achieved in the resolution of this problem.
During this project, PetroChina also noted that water in products also affects their optical signatures. Subsequently, PetroChina also identified a refinery hydrogenation process problem that resulted in poor product quality. This problem was identified "online" by pipeline controllers using the optical analyzer.
This experience has highlighted the ability of optical technology to yield greater information on product quality.
While OID technology was initially used only for batch detection, it may have potential use for online identification of problems with product quality before they impact customers.
Unlike density, optical technology seems to yield greater detail related to product quality and may be more sensitive to product-quality problems (particulates, water, and contamination). Formation of user groups and further publication of this type of learning would help all pipeline companies improve product quality for our customers.
With the introduction of more exotic fuels such as ultralow sulfur, optical technology can play a key role in ensuring that product quality is protected during transportation.
The authors
Zheng ChengZhen is director of the main control center and senior engineer for PetroChina Pipeline Co. of PetroChina Co. Ltd., LangFang, HeBei, China. He graduated in 1985 from the University of Petroleum in China and joined the China National Petroleum Co. upon graduation.
Tim Harbert, at the time of this project, was automation team leader for Colonial Pipeline Co.; he has since joined Kam Controls Inc., Houston, as its president. He also worked as a measurement and volumetric accounting supervisor for what used to be ARCO Pipeline Co. Harbert holds a BS (1987) in business management from the University of Redlands, California, and an EMBA (1991) from the Peter F. Drucker School of Management, Claremont, Calif.
