Worldwide refiners' needs to produce cleaner fuels and operate to meet environmental regulations, convert more heavy feedstocks to satisfy regional fuel market needs, and maximize profit margins continue to guide developments in the refining catalyst market.
Sales of refining catalysts will improve to $2.52-2.67 billion in 2007 from $2.22 billion in 2001, a growth rate of 2.3-3.4%/year. The higher estimate assumes that planned construction for new units and expansions through 2007 will actually occur.
According to the high estimate, the refining catalyst market will grow about 4.4%/year in hydrotreating, 2.1%/year in FCC, 5.0%/year in hydrocracking, 1.4%/year in naphtha reforming, and 7.6%/year in isomerization. Most growth will occur in North America, Asia Pacific, and the Middle East.
Oil company consolidations will continue; fewer buyers create more buying power. The catalyst market will become more aggressive because producer companies will compete for the business of fewer and larger refining companies. This makes the refining catalyst market the most competitive segment of the global market.
The number of catalysts and producer companies will continue to diminish. Catalyst companies will perform strategic alliances, mergers, joint ventures, and acquisitions to respond to refinery profit margins and environmental pressures.
Refining processes will become more efficient and sophisticated; therefore, they will demand new catalysts that will make the business more attractive for catalyst producers. The number of patents related to new product formulations and processes will diminish due to the dynamic and competitive market.
Refining catalyst demand will decrease slightly because technology improvements will make them more active on a volume basis. New-generation catalysts will consume equal or less hydrogen than current catalysts. New active materials will be more resistant to deactivation under severe operating conditions.
Worldwide refining
The refining industry processes a high volume of crude oil in a dynamic and competitive business environment. The industry represents a classic "commodity" business that has four market types: mature, high growth, growth, and low growth. Business environments in each region force refiners to adopt different strategies and to build different degrees of conversion capacity (OGJ, Mar. 24, 2003, p. 58).
Refiners in mature markets continue to consolidate operations, rationalize refining capacity, and increase performance of existing facilities. Refiners in growth markets are increasing their capacity to match product demand slates that are different than in mature markets.1
In general, growth areas have smaller gasoline-to-diesel product demand ratios; therefore, the refineries possess different configurations and conversion levels (hydroskimming, mild conversion, and deep conversion).
Western Europe and US refineries have markedly different modes of operation. In 2002, gasoline, diesel, and fuel oil consumption in Western Europe was 4.02 million b/d, 6.69 million b/d, and 2.03 million b/d, respectively. In the US, the consumption of these fuels was 9.18 million b/d, 5.72 million b/d, and 0.64 million b/d, respectively.2
Western Europe has more diesel and jet fuel demand, and lower gasoline and heating gas oil demand due to more diesel engines and because natural gas is the main source of energy for domestic heating. Refiners, therefore, have more hydrotreating and hydro- cracking capacity and less FCC capacity.
Expansions of current units and construction of new hydrotreaters and hydrocrackers will add about 534,000 b/d and 100,000 b/d, respectively, to the total European refining capacity by 2006.
European refiners must produce more diesel fuel, reduce gasoline yield, and decrease the production of heating oil. The principal outlet for excess European gasoline is for export to US markets.
Fig. 1 shows historical gross margins for Western Europe.
Since 1997, many factors have upset the world oil markets. The consequences of Asia's financial crisis made 1999 a disastrous year for many refiners. In 2000, gasoline exports to the US boosted Europe's refining margins while 2002 showed the worst margins in the last 10 years.
The terrorist attacks of Sept. 11, 2001, caused a loss of middle distillate demand and high volatility for crude oil prices and profit margins in 2002.3
Europe's outlook is for weak hydroskimming margins with additional mild and deep-conversion capacity to meet future demand patterns.
US refiners have focused on investments to meet clean-fuels specifications and increased gasoline yields. US refiners reportedly plan to build 16 new or expanded hydrotreaters during 2004-06. These new facilities will add about 472,900 b/d of capacity.
The regulatory pressures for cleaner fuels in the US vary from state to state. The gasoline deficit in the US will grow to 2 million b/d in 2010 from about 850,000 b/d in 2003. The increasing deficit of gasoline will create greater differences between regional gasoline prices.
Asia-Pacific represents the greatest growth potential but also the greatest uncertainty. Demand is predominantly for middle distillates, although there is also an increasing demand for naphtha as a petrochemical feedstock.
Asia-Pacific refining margins, however, were affected in past years by overcapacity due to decreasing oil demand and consumption, and the construction of new refineries. In fact, Asia currently has the lowest utilization rates in the world. Refiners there will focus on increasing upgrading capacity to meet the demand profile of the region rather than creating more capacity.1
Current catalyst market
The catalyst business continues to evolve. The global market grew to $10.5 billion in 2001 from $7.4 billion in 1997, growth of about $770 million/year (Table 1). By 2007, the global market will increase to about $13.5 billion, with a growth rate of about 4.8%/year.4
Environmental catalysts constitute the largest segment of the catalyst market, accounting for 27% of sales, followed by polymers (22%), refining (21%), petrochemicals (20%), and fine chemicals and intermediates (10%). By 2007, the forecast global catalyst market distribution will be: environmental 30%, polymers 22%, refining 21%, and chemicals 27%.
The refining catalyst market is the most competitive segment of the global catalyst market. In fact, all catalysts are sold on a bid contract basis that makes the catalyst companies more competitive than other markets.
The refining catalyst market increased to $2.22 billion in 2001 from $2.07 billion in 1997, an increase of $35 million/year. According to the Catalyst Group Research Co., the catalyst market for refining, environmental, polymers, fine chemistry and intermediates industries will grow at about 1.9%/year, 7.9%/year, 5.7%/year, and 5.7%/year, respectively, during 2001-07.4 The petrochemical segment, however, will remain practically unchanged during this period.
Fig. 2 shows the global catalyst market distribution forecast in 2004 and 2007, respectively.
Refining catalyst trends
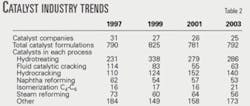
Catalyst companies experienced numerous mergers and acquisitions in the past 5 years. Of the 31 catalyst companies reported in OGJ's 1997 catalyst survey (OGJ, Oct. 6, 1997, p. 41), only 25 remained in 2003.
Companies have changed names and some products were reallocated from one company to another as a result of acquisitions.
Table 2 shows that OGJ's 2003 catalyst survey reported about 792 catalyst formulations as compared to 781 in 2001 (OGJ, Oct. 8, 2001, p. 56) and 825 in the 1999 survey (OGJ, Sept. 27, 1999, p. 45).
Acquisitions and name changes were reported in an earlier article (OGJ, Sept. 2, 2002, p. 48). Some of the changes during 2002-03 include:
- Engelhard Corp. and Sasol Ltd. formed an alliance to produce Fischer-Tropsch catalysts in De Meen, The Netherlands.
- W.R. Grace & Co. and Borealis AS reached an agreement whereby Grace would produce, market, and sell some Borealis polyolefin catalysts.
- Advanced Refining Technologies LLC purchased Orient Catalyst Co. Ltd.'s hydrotreating business.
- A private consortium acquired Ondeo Nalco Co., which will operate as an independent company.
The catalyst industry has felt pressures from refiners that request price concessions, more technical support, engineering solutions, and speedy new product development for increasing process efficiency and to meet future fuel-quality specifications.
Future environmental restrictions are forcing refiners to increase hydrotreating capacity and catalyst consumption. In 2004, many countries will enact new diesel and gasoline sulfur specifications, which will impose a maximum level of 50 ppm. In 2008-10, the maximum sulfur level permitted in these fuels will be 10 ppm.
Because fuels are becoming specialty chemicals, there will be opportunities for new catalyst formulations to help control the composition of these products at a molecular level. Whether the refiners install more catalysts in their units or use current systems while regenerating more frequently, they will consume more catalyst/bbl of product.
Refiners want catalysts that are more resistant to deactivation under severe operating conditions and consume equal or less hydrogen than currently available catalysts. Refining catalyst demand will decrease as technology improvements make the catalysts more active.
Other trends include the increasing sophistication of refineries and their integration with petrochemical complexes. Refiners require more processing capacity and higher efficiency to satisfy regional fuel market needs; therefore, more catalyst consumption is needed.
Refiners are also creating more by-products due to changes in composition and are trying to get these streams, which in the past were blended or sold at lower value, into petrochemicals.
Novel catalysts are required to make propylene from FCC units or to convert naphtha cuts to aromatics. New additives are needed to reduce sulfur and nitrogen oxide emissions from FCC units.5
The mergers within the oil companies over the past 5 years reflect a negative trend for catalyst companies. Consolidation among oil companies is reducing the market base for catalyst producers. Large players benefit from strong buying power, which makes it difficult for catalysts companies to raise prices. This trend will continue.
Worldwide processing capacity
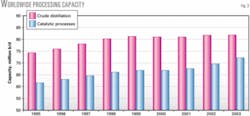
Fig. 3 shows worldwide crude distillation and capacities corresponding to the catalytic processes of hydrotreating, FCC, hydrocracking, naphtha reforming, and isomerization during 1995-2003. Two periods of processing capacity growth are 1995-99 and 1999-2003.
In 1995-99, the global crude distillation and catalytic processing capacity experienced an average increase of about 1.78 million b/d/year and 1.33 million b/d/year, respectively.
Since 1999, every global region has experienced yearly refinery shutdowns; therefore, world crude distillation capacity remained flat during 1999-2001. More significant changes have occurred in the mature areas. Refining capacity increased by about 345,000 b/d/year in this period.
Annual worldwide crude distillation and refining capacity grew by about 440,000 b/d and 2.27 million b/d, respectively, during 2001-03 despite the total number of refineries decreasing to 717 from 732.
Although the number of refineries has decreased in North America, Western Europe, and South America, the performance and refining capacity of the remaining refineries has increased (Fig. 4).
The Middle East and Africa also experienced a significant processing capacity increase despite the total number of refineries remaining constant. This refining capacity increase indicates that the remaining refineries are larger, and new plant construction and expansions of current processes units occurred during 2001-03.
Western Europe and Middle East refineries have the largest average crude distillation capacity in the world (about 141,000 b/d).
North American and South American regions experienced the largest average refinery capacity growth (36% and 22%, respectively) during 1995-2003.
Fig. 5 shows the capacity of primary catalytic processes. Catalytic processes represented about 82% of the total crude capacity during 1995-2001. This increased to about 88% in 2003, which indicates that refining complexity has increased.
In 1995-99, the average hydrotreating capacity increased 845,000 b/d/ year (2.5%/year), FCC 255,000 b/d/ year (2.0%/year), naphtha reforming 40,000 b/d/year (0.4%/year), hydrocracking 145,000 b/d/year (4.2%/ year), and isomerization 40,000 b/d/ year (3.2%/year).
In 1999-2002, hydrotreating capacity grew 910,000 b/d/year (2.6%/ year), FCC 143,000 b/d/ year (1.0%/year), naphtha reforming 57,000 b/d/year (0.52%/year), hydrocracking 138,000 b/d/year (3.4%/year), and isomerization 58,000 b/d/year (4.0%/year).
In 2001-03, construction of new plants and expansions of current facilities increased capacity about 1,655,000 b/d/year for hydrotreating (4.5%/year), 230,000 b/d/year for FCC (1.7%/year), 135,000 b/d/year for naphtha reforming (1.2%/year), 130,000 b/d/year for hydrocracking (3.0%/year), and 115,000 b/d/year for isomerization (8.1%/year).
These trends will continue.
Refining catalyst market
The refining catalyst industry is a high-volume business. During 1999-2001, however, market growth was slower than expected. Catalyst oversupply, especially for FCC catalysts, led to strong competition and price wars.
Regional economical difficulties and refinery shutdowns affected the oil market and catalytic processing capacity growth. The refining catalyst market business has consequently grown at a rate slightly greater (about 1.2%/year) than world oil consumption (0.9%/year) during 1999-2001. Despite this slow overall growth, however, there are signs of a refining catalyst market recovery and more opportunities for expansion when the new environmental restrictions start up.
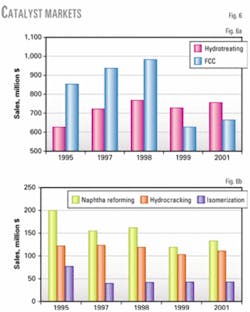
Fig. 6 shows the historical catalyst market behavior during 1995-2001. The FCC catalyst market decreased to 30% in 1999 from 45% in 1998 due to excess inventory and pricing pressure from refiners.
In 2001, hydrotreating and FCC catalysts represented 34% and 30% of the refining catalyst market, respectively; they will experience the most growth in the next few years. Naphtha reforming, hydrocracking, and isomerization represented 6%, 5%, and 2%, respectively, of the global refining catalyst market.
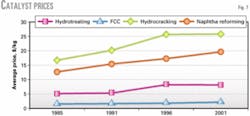
Fig. 7 shows historical catalyst prices for the main catalytic processes.
Future catalyst market
Some construction plans for 2001-05 have been delayed or cancelled due to oil price instability, margin volatility, and cost increases due to risk insurance coverage. Refiners must eventually invest in new units or upgrade and expand current facilities to produce cleaner fuels and adapt to product demand to their respective regional needs (OGJ, Mar. 24, 2003, p. 58; OGJ, Nov. 25, 2002, p. 54).
A recent construction survey reveals plans for 13 new refineries that will add about 1.42 million b/d by 2006 (OGJ, Nov. 24, 2003, p. 20).
Construction, revamps, or expansions are under way for about 2.83 million b/d (101 units) in hydrotreating, 0.73 million b/d (17 units) in FCC, 0.39 million b/d (20 units) in reforming, 0.49 million b/d (15 units) in hydrocracking, and 0.19 million b/d (18 units) in isomerization.
Two different catalyst market estimates were developed.
Estimate 1 projected increasing refinery capacities registered during 1999-2003 for the different catalyst processes and using the calculated catalyst consumption factors from 2001: 17.9 bbl/$ for hydrotreating, 7.6 bbl/$ for FCC, 30.2 bbl/$ for naphtha reforming, 14.2 bbl/$ for hydrocracking, and 11.8 bbl/$ for isomerization (OGJ, Sept. 2, 2002, p. 48).
Estimate 2 accounts for added refining capacity due to construction, revamps, and expansion plans.
Table 3 shows the future catalyst markets according to these estimates.
The five previously mentioned catalytic processes currently represent about 77% of total refining catalyst market. If this proportion remains constant during the next years, the future catalyst market will increase to about $2.52 billion (2.3%/year) in 2007, according to Estimate 1, and to about $2.67 billion (3.4%/year), according to Estimate 2.
Estimates 1 and 2 are 2.0% and 8.0% higher, respectively, than a forecast from The Catalyst Group, which reported a $2.47 billion refining catalyst market by 2007 (Fig. 2).4
Estimate 2 shows that the refining catalyst market will grow about 4.4%/ year for hydrotreating, 2.1%/year for FCC, 5.0%/year for hydrocracking, 1.4%/year for naphtha reforming, and 7.6%/year for isomerization. Most growth will occur in North America, Asia Pacific, and the Middle East.
If catalyst prices remain unchanged during 2001-07, then hydrotreating, FCC, naphtha reforming, and hydrocracking catalyst consumption will be about 117,778 tons, 357,612 tons, 7,273 tons, and 5,538 tons, respectively.
Acknowledgment
The author thanks the Direction Générale des Technologies, de la Recherche et de l'Énergie de la Région Wallonne and F. Somers.
References
1. Hoffman, M.P., "The Refinery of the Future," presented to the 8th Annual ERTC Conference, London, Nov. 18-19, 2003.
2. BP Statistical Review of World Energy, BP PLC, London, June 2003.
3. Wilcox, M., "The Outlook for European Refining," presented to the 8th Annual ERTC Conference, London, Nov. 18-19, 2003.
4. Challener, C., "Catalyst market strives for innovation," Chemical Market Report, June 2, 2003.
5. Watkins, K., "Catalyst Producers Get Cracking," Chemical & Engineering News, Vol. 22, No. 43, Oct. 22, 2001, pp. 40-42.
The author
Ricardo Prada Silvy is an independent consultant. He was previously the research manager at the Université catholique de Louvain, Belgium. He has previously worked for Petroleos de Venezuela SA (PDVSA), Procter & Gamble Co., and Intevep SA. He also served as a graduate school professor in the chemical engineering department at the Universidad Central de Venezuela. Prada Silvy holds a BS (1981) in chemistry from Universidad Central de Venezuela and an MSc (1984) and PhD (1987) in catalysis and material science from Université catholique de Louvain. He is a member of Venezuelan Catalysis Society and Venezuelan Chemistry Society.


