A proposed technique determines the hydrocarbon recovery factor and mobility from resistivity logs.
This technique provides the petrophysicist with the following benefits:
- In the early stage of a well's life, a resistivity-derived recovery factor (RF) can indicate whether further work is needed in a well, especially in the case of a water-drive reservoir.
- Hydrocarbon movability (HCM) is an excellent indicator for determining movable hydrocarbons before a well test.
- Oil mobility values are helpful in selecting perforation intervals.
Field examples from the Western desert of Egypt demonstrate the application of this technique.
Log calculations
Evaluators normally use resistivity logging data to derive water saturation with porosity values determined from porosity logs (neutron and density). They base their initial oil or gas in place calculations on hydrocarbon saturation, porosity, and thickness derived from openhole logging data for a given drainage area.
Archie's equation F = a/φm is accurate in water-saturated zones, but this relationship does not hold in partially saturated zones for which it calculates the apparent formation resistivity factor (Fa). In Archie's equation, φ is the formation resistivity factor, f is porosity, and a and m are constants that depend on the type of rock.
The mobility of hydrocarbon through porous media influences hydrocarbon recovery. The reservoir rock, fluid properties, and pressure gradient control the mobility.
One can calculate oil in place either with a volumetric method or with material-balance studies. Also, to determine the recovery factor, one can use displacement-efficiency studies and correlations based on statistical studies for a particular reservoir mechanism.
This article presents a new concept of determining the recovery factor from resistivity logs. A recovery factor deduced from resistivity data can foresee the final recovery factor after one compiles all petrophysical, reservoir fluids, and geological data after a certain period of production.1-3
Field examples show that resistivity-derived factors can predict the recovery factor in a given well, which may be extended to the related reservoir. Also the oil mobility factor indicates the hydrocarbon mobility under normal conditions.
Theory
The study based the hydrocarbon recovery factor on the tendency of fluid to move away from the borehole because of mud invasion.
Under normal conditions, two factors control the invasion profile:
1. Drilling fluid conditions.
2. Fluid and rock properties.
Drilling fluids and mud pressure both affect the invasion profile. Among fluid and rock properties, the factors most affecting invasion are fluid viscosity, rock permeability, and effective formation porosity.1-4
The normal invasion profile has primarily two zones: the flushed zone where the mud filtrate is the main saturating fluid and the virgin zone where the main saturating fluid are oil, gas, or water.
In practice, clean formations always contain residual oil in addition to free water in the flushed zone.
Shaly formations contain bound water, the amount depending on formation-water chemical composition, clay mineral type, and shale volume.7 8
Clean formations
In clean formations, the Archie equation, F = a/φm, can calculate the formation water saturation, Sw, and clean formation water saturation models determine the flushed zone saturation, Sxo. Equations used are Sw = (FRw/Rt)0.5, and Sxo = (FRmf/Rxo)0.5.
In these equations, Rt is true resistivity of the virgin formation, Rw is the brine resistivity, Rmf is the resistivity of the mud filtrate, and Rxo is the resistivity in the flushed zone.
Shallow log readings in the flushed zone and deep log readings in the virgin zone provide the resistivity data for determining the recovery factor from resistivity logs.
Completely saturated formation
For completely water-saturated formations, the formation resistivity factor, F, is a rock property that relates rock electrical properties to rock porosity and compaction cementation conditions.
A given rock has a constant formation resistivity factor under the same conditions (similar rock and fluid properties).
For Sw = 100%, F = a/φm = Ro/Rw, where Ro is rock resistivity for rock that is completely saturated with a brine having a resistivity Rw.
In a given rock, this equation is correct as long as the pore spaces are completely saturated with water.
Partially saturated formation
In case of partially saturated formation, the calculated formation resistivity factor is different from the value obtained in the 100% water-saturated case. In the virgin zone, Fd = Rd/Rw, where Fd is an apparent formation resistivity factor, Rd deep log reading, and Rw is formation water resistivity at formation temperature.
In the flushed zone, Fs = Rs/ Rmf, where Fs is an apparent formation resistivity factor, Rs is the shallow log reading in the flushed zone, and Rmf is the mud filtrate resistivity at formation temperature.
Formation resistivity factors can take the F-vs.-depth form. The area under the F curve represents the portion of the water volume in the effective pore volume defined by the effective porosity.
The area between Fd and F represents the initial oil in place, the area between Fs and F represents the residual oil, and the area between Fd and Fs represents the movable oil.
The relationship between these terms is as follows:
The section contains water if
F = Fs = Fd.
The section contains immovable hydrocarbons if F < Fs and Fs = Fd.
The section contains movable hydrocarbons if F < Fs and Fd > Fs.
The equation for the recovery factor (RF) then is:
RF = [(1/Fd0.5 – 1/Fs0.5/(1/ Fd0.5 – 1/F0.5)]
The flushed zone and virgin zone fluid saturation indicates the ability of hydrocarbon to move. The hydrocarbon movability factor HCM = (Fs/Fd)0.5 is a good indicator of movable hydrocarbons. The ratio (Fs/Fd)0.5 ranges from 0.0 to 1.0.
Experience shows that the hydrocarbon is movable if HCM is less than 0.75.
When the value of HCM is less than 0.25, the movable hydrocarbon is either gas or light hydrocarbon. For HCM values between 0.25 and less than 0.75, the moving hydrocarbon is oil.
When HCM is greater than or equal to 0.75, the oil is immovable.
This HCM factor helps define the ability of hydrocarbon to move and therefore the well productivity as well as the type of movable hydrocarbon.
The technique of predicting hydrocarbon recovery factor and movement with resistivity logs is based on two assumptions:
1. There is no significant change in rock petrophysical properties, such as permeability and porosity in the area around the borehole caused by mud invasion with reference to formation porosity and permeability at the time of production.
2. The fluid flow regime during mud invasion, in which formation fluids are flushed away, is similar to the fluid flow regime during production, in which formation fluids move towards the wellbore.
Limitations
One can apply the recovery factor and hydrocarbon movability technique mainly in wells drilled with water-base mud. More study is needed before applying this technique to wells drilled with oil-base mud and in the case of depleted reservoirs. Also the recovery factor and oil mobility values may become inconclusive in the case of thin laminated shaly sand layers.
This technique has limited applications in case of thin layers, where the resistivity tools have vertical resolution problems, and in the case of dissolved gas reservoir, gas-cap reservoir, and highly depleted reservoirs.
Examples
Six examples from Western desert fields in Egypt show how the technique can be used.
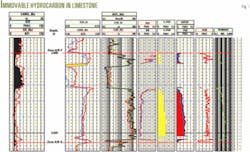
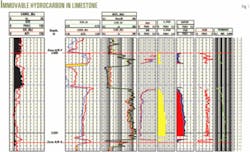
The first example is from a well that encountered a limestone formation, designated as A/R-F (Fig. 1). In Fig. 1, Tracks 1-4 are log data. Track 5 shows that interval 2,616-2,626 m is hydrocarbon bearing.
Track 8 shows that the HCM is greater than 0.75, which indicates that the hydrocarbon is immovable.
Well testing this interval did not produce oil and thus confirmed the results of HCM factor.
This hydrocarbon immaturity is explained by the fact that A/R-F is the source rock in studied area.
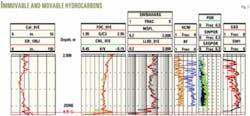
The second example (Fig. 2) also shows immovable hydrocarbons in the A/R-F formation. Water saturation values in Track 6 indicate that A/R-F has oil in the interval 2,500-2,515 m. The HCM factor, Track 5, shows that this oil is movable in the interval 2,507-2,515 m (HCM is about 0.58), while the interval 2,500-2,507 m has immovable oil (HCM is greater than 0.80).
Oil immaturity in the upper interval and maturity in the lower interval indicate that this well is in an area where A/R started to move from a source rock to a producing formation. A test in a nearby well validated this conclusion.
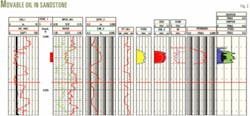
The third example is from a well producing from a sandstone reservoir, lower section of A/R-G formation (Fig. 3). The flushed saturation, Sxo, and water saturation, Sw, curves in Track 7 indicate hydrocarbons in interval 3,507– 3,512 m.
Truck 8 shows that the HCM factor is in the range of 0.39, indicating movable hydrocarbon.
The recovery factor, RF, in Track 8 shows a good predictive recovery factor of about 0.5. This interval has tested oil and the well production increased to 600 bo/d from 150 bo/d after perforating this interval.
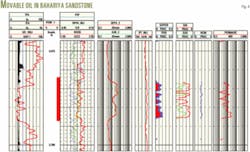
The fourth example is from a sandstone reservoir in the Bahariya formation (Fig. 4). The logs show that interval 3,682-3,693.5 m contains hydrocarbons. Track 7 shows the Sw and Sxo curves.
Hydrocarbon movability factor HCM, Track 8, is in the range of 0.39. This low value indicates that either the hydrocarbon is light or the interval contains gas associated with the oil production. A well test produced 1.7-2 MMscFd of gas and 650 bo/d from this interval, thus confirming the HCM factor prediction.
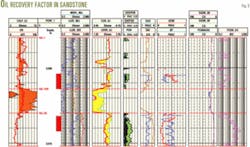
The fifth example (Fig. 5) is from a well producing oil from two intervals: 3,552- 3,557 m with moderate permeability and porosity and 3,566-3,571 m with greater porosity and permeability (Tracks 5 and 9).
These intervals are hydrocarbon bearing as depicted by Sw and Sxo curves in Track 6. The HCM curve (Track 7) indicates that lower interval (average HCM = 0.27), is better than upper interval (average HCM = 0.57).
The recovery factor in the lower interval is about 0.48 and in the upper interval is about 0.24. Dynamic model results, after putting the well on production, confirmed these results.
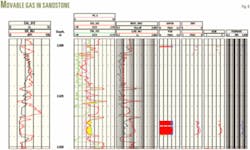
The last example (Fig. 6) is from a well the produces gas from a sandstone reservoir in the A/R-G formation.
Intervals 2,637-2,639 and 2,640-2,644 have hydrocarbon potential based on logging data analysis. Track 6 shows Sw and Sxo for these intervals.
The HCM in Track 7 has values of 0.17 and 0.21. These values indicate that these are gas producing intervals.
Well test confirmed this by producing 12.8 MMscFd of gas and 570 bo/d.
References
1. Archie, G.E., "Electrical resistivity log as an aid in determining some reservoir characteristics," Trans. AIME, Vol. 146, 1942, pp. 54-62.
2. Winsauer, W.O. and McCaRdell, W.M., "Ionic-Double layer conductivity in reservoir rocks," Trans. AIME, 1954, pp. 17-23.
3. Shouxing, M. and Xiaoyum, Z., "Determination of Archie's cementation factor from capillary pressure measurement," Trans. Intl. Symposium on Well Logging Technology, Xian, China, 1994, pp. 83-103.
4. Al-Saddique, M.A., Hamada, G.M., and Al-Awad, M.N., "Engineering coring and core data analysis," Emirates Journal for Engineering Research, Vol. 6, No. 1, pp. 39-49, 2001.
5. Maute, R.E., Lyle, W.D., and Sprunt, E., "Improved data analysis method determines Archie's parameters from core data," JPT, January 1992, pp. 103-07.
6. Hamada, G.M., Al-Awad, M.N., and AlSughayer, A.A., "Water saturation computation from laboratory 3D regression," Rev. IFP, Vol. 57, 2002, pp. 637-51.
7. Brown, G.A., "The formation porosity exponent; the key to improved estimates of water saturation in shaly sands," Trans. of 29th Annual Logging Symposium of SPWLA, [exact dates]1988.
8. Woodhouse, R., "Accurate reservoir water saturation from oil-mud cores- questions and answers from Prudhoe Bay and Behind," The Log Analyst, Vol. 39, No.3, 1996, pp. 23-47.
The author
Gharib M. Hamada ([email protected]) is a professor of well logging and applied geophysics at Cairo University, Egypt. Previously he was with King Saud University, Riyadh, Technical University of Denmark, Copenhagen, and Sultan Qaboos University, Muscat. His research interests are well logging data analysis, seismic modeling, and reservoir description. Hamada holds a BS and an MS in petroleum engineering from Cairo University and a DEA and a Doc. D'Ing. from Bordeaux University, France. He is an SPE, and SPWLA member.
