Here's why current imports are limited, how they will grow
LNG IN THE US—2
Tracking LNG production trains is more useful in projecting US LNG imports to the East and Gulf Coasts because imports will generally be limited by the availability of LNG, not import terminal capacity.
West Coast imports, on the other hand, can be estimated by tracking the number of terminals that are approved and constructed. LNG imports to the US West Coast will be limited by the number of terminals developed, unless more than two or three come online.
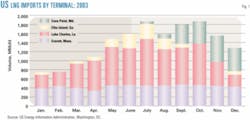
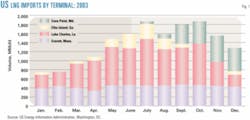
Examining US LNG imports in 2003 (Fig. 1) provides a good starting point for understanding the terminal vs. train issue.
LNG in 2003
US imports of LNG in 2003 increased by 121% over 2002 to 506,519 MMcf (506.5 bcf). This represented an average of 1,388 MMcfd.
As Part 1 in this series (OGJ, Apr. 12, 2004, p. 70) showed, LNG imports in 2003 demonstrate that terminal capacity does not necessarily determine the level of imports: LNG imports in 2003 were usually less than the capacity of the import terminals.
The capacity of the import terminals was about 2 bcfd in the first half of the year and ramped up to roughly 3 bcfd after the terminal at Cove Point, Md., reopened at the end of July 2003. Only in July did LNG imports approach the limitation imposed by terminals' capacities.
LNG imports in November and December are particularly noteworthy. Imports in these months after the opening of the Cove Point terminal were considerably less than the capacity of the import terminals. The opening of Cove Point did not automatically mean, therefore, that additional LNG was imported into the US.
Over the next several years, US LNG imports are likely to be limited to levels considerably below the capacity of the LNG import terminals.
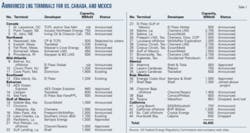
Many new LNG import terminals have been proposed, along with expansions of existing terminals. Table 1 lists the announced terminals, as of first quarter 2004, for the US, Canada, and Mexico. There are 44 terminals included on the list, although a few have already been dropped.
If all the announced terminals were built and announced expansions of existing terminals carried out, total LNG import capacity would reach 44,455 MMcfd, a level more than two-thirds current natural gas consumption in the US.
Clearly, not all announced terminals are needed to meet US demand; only a few out of the total number of announced terminals will be built.
Pacific Basin imports
While US LNG imports were usually limited by the availability of LNG in 2003, future terminals may be the limiting factor on the West Coast, not the sources. In the Pacific Basin, tracking LNG terminals that are approved and constructed provides useful insight into future West Coast LNG imports. There are a large number of existing and future sources of LNG in the Pacific Basin.
West Coast LNG imports are also limited by the market at which they are targeted. West Coast LNG terminals are focused on California, Arizona, and Northern Baja, Mexico. Currently, California is the largest of these markets with total pipeline import capacity 8,310 MMcfd.1
Each proposed LNG import terminal represents about 1 bcfd of capacity. Thus, two or three LNG import terminals are probably the most that can be accommodated in the California market without causing significant market disruptions. In the calculation of total US LNG imports (Table 2), two West Coast terminals are assumed to be built. US imports from these terminals are assumed to be 1.5 bcfd, with additional LNG consumed in Baja, Mexico.
Atlantic Basin imports
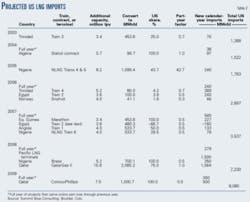
East and Gulf Coast imports are more likely to be limited by the availability of LNG than by terminals' capacities. Table 2 presents an analysis of LNG production trains supplying the East and Gulf Coasts, as well as other sources, in order to arrive at total US LNG imports.
LNG production trains also provide a good indicator of future imports because they can be tracked for several years before imports begin. It generally requires 4-5 years from the time a train is announced until it comes on line because agreements must be negotiated, permits obtained, gas production developed, engineering design performed, and train construction completed.
While the outlook for trains can be determined several years ahead of time, the ownership or allocation of a train can change. Table 2 is based on the current allocations of LNG production trains, as well as they can be determined, and shows only trains that are planned to supply LNG to the US.
There are other trains in development, but they are not targeted to supply LNG to the US. The ownership or allocation of LNG from trains, however, can change to take advantage of market opportunities as they develop during the time the train is under construction.
The contracts for most trains include a destination for their LNG cargoes. Some contracts provide a considerable degree of flexibility, however. A company may consign for a certain amount of LNG from a train, for example, but state that the LNG will go to the US, Europe, or Mexico.
In cases like this, the allocation in Table 2 is an estimate that splits the LNG among its projected markets. Because the allocation of LNG from trains will undoubtedly change, Table 2 should be considered as only a guide to the current outlook that will require ongoing refinement and updating.
Table 2 starts with the capacity of each train in million tons/year (tpy) then converts this capacity to million cu ft/day (MMcfd) by first multiplying by 48,700 MMcf (per ton of LNG) then dividing that result by 365 days/year. The estimated share of the project destined for the US is then factored in the calculation.
A calendar factor is incorporated in a train's first year to account for the train's coming online part way through the year. If the start-up date is unknown, a calendar factor of 0.5 is applied.
In the year following the first year of operation of a train, the table adds the amount necessary to account for a full year of train operation.
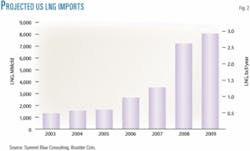
Fig. 2 summarizes the resulting projections of LNG imports.
LNG outlook
The outlook for LNG, as shown in Table 2 and Fig. 2, is for modest increases in the first few years followed by more significant increases as more LNG production trains come on line in later years.
LNG imports in 2003 were 1,388 MMcfd and increased, in part, because the third LNG production train in Trinidad and Tobago started up on Apr., 28, 2003. LNG imports in 2004 will increase about 10% in part because this third Trinidad train will be available for the entire year. Also contributing to higher LNG imports in 2004 is a contract for delivery of Algerian LNG from existing trains.
Beyond that, there are no new sources of LNG coming on line in 2004, an outlook that assumes that spot LNG cargoes continue at the same level as in 2003.
As more LNG becomes available, there are more opportunities for spot cargoes.
Thus, an uncertainty band surrounds these forecasts based on changes in spot cargoes of LNG, as well as such other key factors in the analysis as production allocation and start-up date. The farther out the forecast, the wider the uncertainty band because of greater amounts of LNG that can be moved on the spot market.
LNG imports in 2005 will increase primarily due to the start-up of Trains 4 and 5 at Nigeria LNG Ltd. Currently, 43.7% of the output of this facility is allocated to the US market through Shell Gas BV and BG LNG Services Inc. The addition of the imports from these trains would lead to total US LNG imports increasing to about 1,763 MMcfd in 2005, an increase of 16% over 2004 (assuming that spot imports remain at the 2003 level).
LNG imports will likely rise substantially in 2006 and beyond as a significant number of new LNG production facilities come online. New production trains are likely to move LNG to the US from Egypt, Norway, Equatorial Guinea, Angola, and Qatar. The projected total US LNG imports shown in Table 2 jump up in 2008, in particular, due to assumed imports at new West Coast terminals and large new LNG production trains in Qatar.
The Egyptian numbers in the table require some explanation. The US is currently scheduled to receive the full output of Egyptian LNG's Train 2 until a new import terminal is completed in Italy. After that, the output of the Egyptian train will be split between the US and Italy.
The outlook for total US LNG imports is 1,522 MMcfd in 2004, 1,763 MMcfd in 2005, 2,697 MMcfd in 2006, 3,537 MMcfd in 2007, 7,230 MMcfd in 2008, and 8,080 MMcfd in 2009.
This outlook will likely require updating and refining over time to account for changes in spot cargoes, alterations in train ownership, changes in destination allocation based on market opportunities, development of additional trains, cancellation of announced trains, or changes in online dates.
Reference
1. California Energy Commission, Natural Gas Market Assessment, Staff Report 100-03-006, August 2003, p. 37.
