2003 shows spot cargoes, tankers to dictate US LNG supplies, not terminal capacities
LNG IN THE US—1
Examining US LNG imports in 2003 provides an understanding the changes projected for LNG in the next few years.
Last year, LNG imports more than doubled from 2002. Incremental imports were mostly from Trinidad and Tobago or were spot cargos that were concentrated in the summer when natural gas is not needed in other places in the world. In only a few months of 2003 were US LNG imports close to the import capacities of the existing terminals.
For the near term, US LNG imports appear to be governed by the availability of spot cargos and tankers and not the capacities of import terminals.
LNG imports in 2003
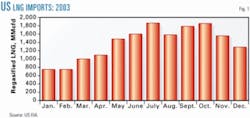
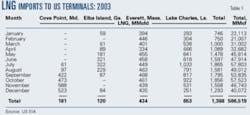
The US Energy Information Administration (EIA) has released LNG import numbers for 2003, subject to final revisions (Table 1; Fig. 1).
LNG became a more important source of natural gas in the US in 2003 but is still a small part of the total supply. The US imported 506,519 MMcf (506.5 bcf) of LNG in 2003, an increase of 121% over the 228,730 MMcf imported in 2002.
LNG represented about 2.3% of the total estimated supply of natural gas in the US in 2003.
Last year, the country imported 1,388 MMcfd of LNG on average. Imports increased in the second half of the year, in part due to the completion in April of the third LNG production train in Trinidad and Tobago.
The average price of LNG imported to the US in 2003 was $4.50/Mcf. Market prices for natural gas averaged more than $5/Mcf in 2003, but that does not mean that LNG cost significantly less than domestic supplies. The import price of LNG is before the cost of regasification. The additional fees for revaporization would put LNG close to the market price for gas.
The US imported LNG under contract purchases and as spot cargos. Contract purchases had an average cost of $4.21/Mcf in 2003, while spot cargoes averaged $4.56/Mcf. Spot purchases ranged from a low of $3.03/Mcf on a cargo from Trinidad in September to a high of $7.70/Mcf on a cargo, also from Trinidad, in March.
LNG by terminal
Table 1 also shows monthly imports of LNG by terminal. With the reopening of the Cove Point, Md., terminal in 2003, all four existing US terminals were operating at the end of the year.
Most of the LNG imports in 2003 came through the Lake Charles, La., terminal, which averaged 653 MMcfd over the year.
Everett, Mass., ran at a fairly consistent level, but the other two terminals that operated for the full year had months in which imports were significantly below capacity.
Elba Island, Ga., had 3 months in 2003 when it received no shipments of LNG.
This may change as BG LNG Services LLC has announced that it is taking over operation of the Elba Island terminal, effective Jan. 1, 2004.
LNG imports in 2003, however, appeared to be limited by the availability of LNG or LNG tankers in most months and not the capacity of import terminals, more about which presently.
In 2003, two terminals operated at or above their base capacities for an entire month and one exceeded its peak capacity for a month.
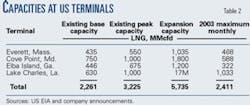
Table 2 shows the stated terminal capacity at the beginning of the year, with both base and peak sendout. Also shown in Table 2 is each terminal's planned capacity after expansion.
The table shows the sum of the maximum imports achieved at all terminals during a month in 2003, though these did not all occur in the same month.
In the cases of Everett and Lake Charles, imports over a month exceeded the stated base capacity for these terminals. Base capacity at Lake Charles, for example, is 630 MMcfd, but its maximum monthly imports in 2003 were 1,033 MMcfd. The data for Cove Point may not indicate its true capability because it was only operating for part of the year.
All terminals are scheduled for expansion, also shown in Table 2. Two new expansions were announced recently. BG LNG and Southern Union Co., Wilkes Barre, Pa., announced in February 2004 a second expansion at Lake Charles to take it to 1.7 bcfd in 2006 from 1.2 bcfd. Also in February, Dominion Resources Inc., Richmond, announced an expansion at Cove Point to 1.8 bcfd.
Imports by origin
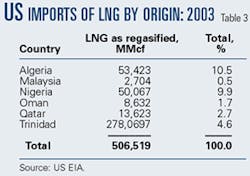
Table 3 summarizes LNG imports by country of origin.
Trinidad and Tobago is by far the largest source of LNG for the US. Atlantic LNG Co. of Trinidad and Tobago accounted for about three quarters of all LNG imported into the US.
Imports of LNG from Trinidad increased in 2003 over 2002 with the completion of Atlantic LNG's third train in April 2003.
The US is to receive 25% of the normal output of this train, with the remainder contracted to Spain. The US has the opportunity to obtain spot cargos above the scheduled output of each of the three trains.
A fourth train is under construction at Atlantic LNG, scheduled for completion in 2007.
Algeria and Nigeria were the second and third largest sources of LNG in 2003, respectively. Each provided about 10% of the LNG imported into the US. Other countries providing LNG to the US in 2003 included Qatar, Oman, and Malaysia.
Spot vs. contract
Only a small portion, about 16.3%, of the cargos brought into the US in 2003 were contract purchases, as defined by EIA.
Most of the LNG supplies to the Everett terminal were contract cargos by Tractebel from Trinidad. Norway's Statoil AS started shipping LNG cargos into Cove Point under contracts that run until 2006.
These are coming from Trinidad and Algeria so that Statoil can utilize the one third of Cove Point capacity rights that it owns. Starting in 2006, Statoil will ship LNG from the Snöhvit field off Norway that is currently under development.
EIA classified 83.2% of 203 US LNG imports as spot cargos. Most of the imports from Trinidad are allocated to the US even though they are listed as spot cargos. Classifying all of the Trinidad imports as dedicated leaves 125,791 MMcf or 24.8% as truly spot cargos.
These are purchases of available LNG that were made from Algeria, Nigeria, Qatar, Oman, and Malaysia.
These incremental spot imports were an important source of LNG in 2003 and will continue to be important in the future.
The incremental spot cargos may help to explain why 2003 LNG imports were highest in the summer months. Spot cargos would appear to be more readily available in summer when heating demand for gas is lower.
The future availability of incremental spot cargos to the US could depend on weather, power plant needs, and other factors in other parts of the world. These incremental spot cargos represent an unreliable source of LNG.
Outlook
Analysis of the 2003 LNG imports does not provide an encouraging outlook for additional imports in 2004 and 2005.
Existing terminals were under-utilized for much of the year, indicating that the import constraint is the source of LNG and LNG tankers and not in terminal capacity.
Opening additional terminals will not, in itself, result in more imports of LNG. Reopening Cove Point, for example, does not automatically mean that more LNG will be coming into the US. Monitoring or tracking all the announced terminals and estimating how many will be constructed will not tell how much LNG will be imported into the US.
There do not appear to be major new sources of LNG in 2004 and the first half of 2005.
Atlantic LNG's Train 3 will be available for the entire year, and Atlantic is also debottlenecking Train 1, which will increase production slightly.
The US should receive additional contract gas from Algeria under the Statoil contract.
Other than that, there appear no significant additional sources of LNG in 2004 because no additional LNG trains are coming on line in 2004. The next increment of firm LNG capacity for the US is likely to be Trains 4 and 5 in Nigeria, which are scheduled to be completed in mid-2005.
The outlook for LNG will be detailed in the second part of this series of articles, but the US will depend on the vagaries of the spot market for incremental LNG supply in 2004 and part of 2005.
The author
Chris Neil ([email protected]) is a senior consultant with Summit Blue Consulting with more than 25 years of utility and utility consulting experience. He has extensive experience in electric and gas price forecasting, power plant evaluation, market analysis, and resource planning. From 1995 until 2002, Neil was with RDI Consulting, now part of Platts, where he was the principal analyst developing forecasts of power prices using integrated electric and gas forecasting models. He was with Hagler Bailly Consulting 1986-95 and started his career at Public Service Co. of Colorado (now part of Xcel Energy) in 1975. Neil holds BS and MS degrees (both granted in 1973) from the Colorado School of Mines and holds an MSIA (1975) from Carnegie-Mellon University.


