In most onshore gas transmission systems, use of a line heater maintains the flowing mixture temperature above the hydrate-formation temperature.
A new analytical technique estimates the appropriate location of the line heaters along natural gas pipelines, applying the general energy equation. An example shows that the proposed technique can be a simple, easy-to-use tool for designing the heating system of a gas transmission line.
Gas hydrates are beneficial as both an important source of hydrocarbon energy and as a means of stor
But hydrates can also be detrimental to pipeline operating systems by depositing hydrate crystals on pipe walls and accumulating as large plugs, leading to blocked pipelines and over pressuring.1-3
Acceleration of these plugs due to pressure gradients can also result in considerable damage to transportation facilities.
These problems have led to considerable interest in preventing hydrate- solid formation in gas transmission systems.4 Depending on the location of the gas-hydrate plug, there are various methods to avoid hydrate formation. In addition, hydrate prevention techniques for offshore gas transmission pipelines are not necessarily usable for onshore pipelines.5
A common technique to avoid hydrate formation in onshore gas transmission pipelines is thermal stimulation, which involves use of a source of heat applied directly as injected steam or hot liquids or indirectly by electricity.
The addition of heat raises the temperature of the pipeline and forces hydrates to decompose.
The direct approach works well during steady-state conditions but is of no benefit in certain transient or shut-in scenarios.6 Indirect heat, however, such as the installation of line heaters for onshore gas gathering and transmission systems, is feasible for these transient conditions. This technology is particularly applicable to transmission and distribution systems that operate in cold climates.7
Note, however, that a less practical means of combating onshore hydrate formation is to operate at a pressure below the hydrate-formation pressure. Line depressurization is not practical, however, in long and high-pressure gas transmission pipelines.2
Predicting conditions
The first problem encountered when designing gas transmission systems is the prediction of pressure and temperature conditions at which hydrates will form.
Naturally, understanding these conditions will be critical to the development of new and improved technologies for controlling gas-hydrate formation in transmission pipelines.2
Numerous methods are available for calculating hydrate-formation conditions. The most reliable correlations require a gas analysis.2 8
If the gas composition is unknown, however, these methods cannot be used to predict hydrate-formation conditions.
The Gas Processors Suppliers Association (GPSA) hydrate-formation chart can be used to predict the approximate pressure and temperature for hydrate formation. Therefore, the first step in predicting hydrate-formation temperature requires an appropriate equation from the GPSA chart.
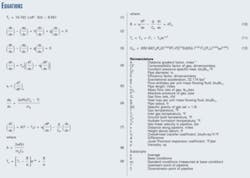
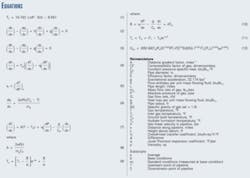
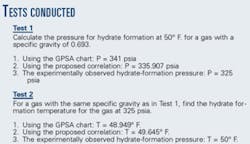
Equation 1 (see accompanying equations box on the facing page) presents such a correlation in which two coefficients are used to correlate temperature, pressure, and specific gravity of a gas.9 This correlation is tested at two conditions and the calculated results compared with experimental data given by GPSA.
The results appear in the accompanying box on the next page.
In both examples, the values predicted by the proposed correlation have good agreement with observed values. Thus, the proposed simple-to-use correlation is recommended for predicting hydrate-forming conditions.
Note that conditions predicted by Equation 1 may be significantly in error for compositions other than those used to derive the GPSA chart.
In addition, this chart does not indicate the composition or type of the hydrate; however, it is an approximation of the conditions at which a hydrate will form.
Temperature profile
Knowing the gas temperature profile at all points along a pipeline is necessary for determining:
The location of the line heaters for hydrate avoidance.
The inlet-gas temperature at each compressor station, required for calculation of compressor power.
The minimum rate of gas flow required to maintain a specific gas temperature at a downstream point.
Current design methods assume the flowing temperature to be constant along the length of the pipe, when in fact a temperature profile exists. Determining the temperature profile requires a fairly complex, trial-and-error calculation.
The temperature-change calculations are based on the energy balance and are iterative because the temperature (and pressure) at each point must be known to apply the energy balance.
Similarly, the flow-pressure-loss calculations are iterative because knowing the pressure (and temperature) at each point along the pipeline is necessary to determine the phase properties from which the pressure drop is correlated.
Another difficulty in generating this precise temperature profile is that the available data are often insufficient. The complexity of this method has led to development of approximate analytical methods for predicting the temperature profile that are satisfactory for most engineering applications.10-12 Obtaining the temperature at a specific distance along a gas pipeline, however, requires use of a regression method to solve these equations numerically.13
The following discussion describes a proposed analytical technique to predict steady-state temperature profile more precisely than existing techniques. Steady-state models are widely used to design pipelines and to estimate flow and line pack.
In many situations, however, an assumption of steady-state flow and its attendant ramifications produce unacceptable engineering results.14
The basis to the proposed analytical method is the thermal energy balance for the steady state, one-dimensional gas flow in a pipeline (Equation 2).15
This equation assumes that the work term is zero between every two subsequent compressor stations and that, therefore, this term does not appear in Equation 2. For most practical purposes, the velocity-change term is small and can be neglected,8 resulting in Equation 3.
For this equation, Equation 4 determines flow enthalpy change.16
The Joule-Thomson coefficient accounts for the temperature reduction due to the pressure drop that occurs when gas expands in a pipeline. This coefficient17 can be calculated from thermodynamic properties (Equation 5).
Equation 6 can estimate the heat transfer from the pipe to the ground (soil), per unit of pipeline length.18 Combining Equations 2 through 6 yields Equation 7 for prediction of flowing gas temperature.
For general case, Equation 7 can be solved numerically. Assuming values of η, Cp, and U to be constant, however, allows this equation to be solved analytically. For the boundary condition of T = T1 at x = 0, Equation 9 has been derived with the assumption that pressure and elevation changes are linear functions of the distance from the inlet of the pipeline.
Equation 9 can calculate the flowing gas temperature (Tx) at any point x along the gas pipeline. This equation is derived with the assumption that pressure and elevation changes are linear functions of the distance from the inlet of the pipeline. Based on this assumption, Equation 9 is best suited for short line segments.
For a long gas transmission pipeline with a moderate to small pressure drop, however, the temperature drop due to expansion is small15 19 and Equation 9 simplifies to yield Equation 11.
Pressure-drop calculation
A key element to the temperature profile prediction is correct calculation of the pressure drop. Obtaining the best value of pressure drop requires a gas flow equation that is valid for all practical operating conditions. Past empirical gas flow equations are not suited for different conditions, particularly when the actual pressure drop is higher than the calculated value.20 21 A recently developed gas flow equation (Equation 12) is more accurate than previously published flow equations.21
Deriving Equation 12 assumed that there are no elevation changes in the pipeline and that the flow is steady state and isothermal, usually satisfactory assumptions for long pipelines. Equation 12 also incorporates an efficiency factor (E), which is intended to correct for these assumptions.22
Most experts recommend an efficiency factor close to unity for the case of dry gas flowing through a new pipe. The presence of liquid in the gas phase, however, results in a drastic reduction in pipeline efficiency factors.23
Example
A 0.55 specific gravity gas flowing at 100 MMscfd moves through a 65-mile pipeline with a 28-in. ID. The inlet pressure and temperature are 1,000 psia and 120° F., respectively. The desired exiting pressure is 800 psia.
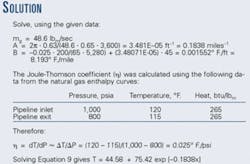
Assuming an overall heat-transfer coefficient of 1 btu/hr-sq ft-°F., gas heat capacity (CP) of 0.65 btu/lbm-°F., and ground temperature of 45° F., how far will the gas travel before it reaches the hydrate-formation temperature? The accompanying box on this page presents the solution.
The hydrate-formation temperature for this gas from Equation 1 is 59.2° F. Simultaneously solving the equation found in the solutions box and the proposed correlation of hydrate-formation temperature yields the location of hydrate formation.
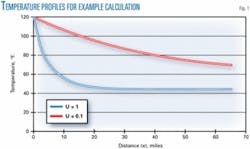
The first location where hydrate forms is 8.92 miles along the pipeline. Equation 11 is often used for most practical gas transmission pipelines, however. With Equation 11 used, the solution with these parameters becomes: T = 45.0 + 75.0 exp [–0.1838x].
Based on Equation 11, hydrate forms 9.04 miles along the line. Equation 11 does not account for the Joule-Thomson effect, which describes the cooling of an expanding gas in a transmission pipeline. When this is neglected, Parameter B will be larger, and thus the fluid in the pipeline will form hydrate later than that predicted by Equation 9.
It should be noted that in this example, the temperature profile is dominated by the heat-transfer coefficient, U, and the Joule-Thomson coefficient only has a minimal effect. According to Equation 9, heating would be required from 8.92 miles until 65 miles to prevent hydrate formation.
This result depends strongly on U and the ground temperature TG. If the pipe were strongly insulated and U reduced to 0.1 btu/hr-sq ft-°F., the line would require no heating at all because the gas would never cool to the hydrate-formation temperature. Fig. 1 illustrates this, comparing the temperature profile for the cases of U = 1.0 btu/hr-sq ft-°F. and U = 0.1 btu/hr-sq ft-°F. F
References
1. Sloan, E.D., Jr., "Clathrate Hydrates of Natural Gases," 2nd Edition, New York: Marcel Dekker Inc., 1998.
2. GPSA Engineering Data Book, 11th Edition, Tulsa: Gas Processors Suppliers Association, 1998.
3. Edmonds, B., Moorwood, R.A.S., and Szczepanski, R., "Hydrate Update," GPA Europe Spring Meeting, May 14, 1998, Darlington, County Durham, UK.
4. Covington, K.C., Collie, J.T., and Behrens, S.D., "Selection of Hydrate Suppression Methods for Gas Streams," proceedings of 78th GPA Annual Convention, Nashville, Tenn., 1999; pp. 46-52.
5. Mokhatab, S., Paez, J.E., and Islam, M.R., "A New Guideline for Gas Hydrate Prevention in Distribution Lines," accepted for 2004 publication in EEC Innovation Magazine.
6. Lervik, J.K. et al., "Direct Electrical Heating of Pipelines As A Method of Preventing Hydrates and Wax Plugs," proceedings of the International Offshore Polar Engineering Conference, Montreal, May 24-29, 1998.
7. Carroll, J.J., Natural Gas Hydrates: A Guide for Engineers, Houston: Gulf Publishing, 2002.
8. Kumar, S., Gas Production Engineering," Houston: Gulf Publishing, 1987.
9. Mokhatab, S., "Simple Correlation Predicts Hydrate Forming Conditions in Gas Transmission Lines," accepted for 2004 publication in Pipeline and Gas Technology Magazine.
10. Schorre, C.E., "Flowing Temperature in a Gas Pipeline," Pipeline Industry, July 1954, p. 94.
11. Forrest, J.A., "Interpreting the Schorre Gas Temperature Equation," Pipeline Industry, February 1978, p. 58.
12. Coulter, D.M., "New Equation Accurately Predicts Flowing Gas Temperature," Pipeline Industry, May 1979, p. 71.
13. Edalat, M., and Mansoori, G.A., "Buried Gas Transmission Pipelines: Temperature Profile Prediction through the Corresponding States Principle," Energy Sources, Vol. 10 (1988), p. 247.
14. Osiadacz, A.J., and Chaczykowski, M., "Comparison of Isothermal and Non-Isothermal Pipeline Gas Flow Models," Chemical Engineering Journal, Vol. 81 (2001), p. 41.
15. Buthod, A.P., Castillo, G., and Thompson, R.E., "How to use computers to calculate heat, pressure in buried pipelines," OGJ, Mar. 8, 1971, p. 57.
16. Papay, J., "Steady Temperature Distributions in Producing Wells and Pipelines," Koolaj and Foldgaz, Reference 11 in Production and Transport of Oil and Gas, by A.P. Szilas, 1975. Developments in Petroleum Science, No. 3, p. 563, Amsterdam: Elsevier Scientific Publishing Co., 1970.
17. Katz, D.L., et al., "Handbook of Natural Gas Engineering," New York: McGraw Hill Book Co. Inc., 1959.
18. Neher, J. H., "The Temperature Rise of Buried Cables and Pipes," AIEE, Vol. 68 (1949), No. 1, p. 9.
19. Mohitpour, M., Golshan, H., and Murray, A., Pipeline Design & Construction: A Practical Approach, New York: American Society of Mechanical Engineers, 2000.
20. Towler, B.F., and Pope, T.L., "New equation for friction factor approximation developed," OGJ, Apr. 4, 1994, p. 55.
21. Mokhatab, S., "New approximation of friction factor developed for general gas flow equation," OGJ, July 1, 2002, p. 62.
22. Campbell, J.M., Gas Conditioning and Processing, Third Edition, Norman, Okla.: Campbell Petroleum Series, 1992.
23. Brill, J.P., and Beggs, H.D., Two-Phase Flow in Pipes, Sixth Edition, Tulsa: University of Tulsa Press, 1991.
The authors
Brian F. Towler is an associate professor of chemical and petroleum engineering at the University of Wyoming. After receiving a PhD (1978) in chemical engineering from the University of Queensland (Australia) and 2 years of post-doctoral research at the University of California at Davis, he was appointed senior reservoir engineer by Arco Oil and Gas Co. In 1983 he returned to Australia to work as the principal reservoir engineer for Oilmin NL and the Moonie Oil Group of Cos. In 1988, he joined the University of Wyoming as assistant professor where he has conducted research on reservoir simulation, water-flooding, petroleum trapping mechanisms, and decline curve analysis. He is a member of SPE and a registered professional engineer in Wyoming.
Saeid Mokhatab is currently pursuing a PhD in multiphase flow engineering at Cranfield University, England. Previously, he has been involved as a technical consultant in design and engineering stages of multiphase flow transmission lines for a number of domestic and international gas-engineering projects. He holds a BSc (1998) in gas engineering from the University of Tehran and an MSc (2000) in chemical engineering from Tarbiat Modarres University, Tehran, Iran. He is a member of Sigma Xi, Missouri Academy of Science, ASME/PSD technical committee, SPE London section board, Canadian GPA, and GPA Europe.
