Porosity and permeability effects in Texas Gulf Coast reservoirs
Exploration for oil involves not only searching for oil but also searching in a financially viable manner. To do this, one should know something about reservoir properties before drilling.
The two most commonly recorded reservoir properties are porosity, defined as the empty space in a rock expressed as a percentage of the rock, and permeability, a measurement of the ability of a rock to transmit fluids expressed as millidarcies.
Different types of cement may also affect both but are almost impossible to measure and predict.
It is often difficult to determine any relationship between porosity and permeability even though such data might be extremely important, and the study of these two properties frequently leads to a number of questions.
Can porosity and permeability be predicted?
How much do they affect each other?
How much effect do variations in either one have on reserves or on other reservoir and fluid properties?
Because it is extremely difficult to predict what the porosity and permeability will be at any point in the subsurface and what if any relationship may exist between the two, it is also difficult to predict how reservoir and fluid properties will react to changes in porosity and permeability.
Although some progress has been made in knowledge of such relationships, a review of porosity and permeability data in an area may not answer all these questions, but a review of these data should lead to a greater understanding of the influences of the two properties on each other and on other properties.
The Texas portion of the Gulf Coast has a long and prolific history of oil production and continues to provide exploration targets. As a result there is a large published data base of 133 reservoirs in the Texas Gulf Coast. The reservoirs have individual recoverable reserves ranging from 6.5 million bbl to 751 million bbl and a total recoverable reserve of 7.5 billion bbl. Data on only two reservoirs with reserves of less than 10 million bbl were available.
Although all reservoirs were in sandstones, information about reservoir properties on salt domes was not included. Besides porosity and permeability, other available information for reservoirs include recoverable reserves, depths of production, oil-column thickness, percent water saturation, API gravity, gas-oil ratio, reservoir pressure and temperature, all of which are used in some type of reservoir studies.
Number of reservoirs
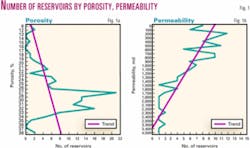
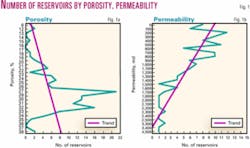
Fig. 1 shows the number of reservoirs with porosity values and the number of reservoirs with permeability values in intervals of 100 md.
One reservoir did not have a porosity value, so data for 132 reservoirs were available. Porosity ranged from 6% to 38% with an average of 28%, only one reservoir had a porosity of less than 10%, and very little data were available for this one reservoir. The largest number of reservoirs with porosity values was 21 with porosity of 28%. The number of reservoirs with porosity in intervals from 28% to 33% was 81, or 61% of the total reservoirs.
So great a range in permeability values was there that it was necessary to plot the low, high, and average values in intervals of 100 md rather than each individual value. Seven reservoirs did not have permeability values recorded, so data for 126 reservoirs were available.
Permeability ranged from 3 to 4,500 md with an average permeability of 879 md. Four reservoirs had permeability of less than 20 md. A total of 13 reservoirs (10%) had one permeability value in the 200-300 md interval, followed by 11 reservoirs at 500-600 md and 10 reservoirs at 800-900 md.
Unfortunately only a few readings were available in the lower porosity values as reservoirs with 15%, 18%, and 19% porosities had only one value each and reservoirs with 12% and 20% had only two values. A few values were present in reservoirs with the higher permeability as eight intervals above 1,800 md had only one value each and reservoirs with permeability of 2,300 md and 3,300 md had two values each.
Following the reservoirs at 1,000-1,100 md, the number of reservoirs with higher permeability decreased rapidly. With so few values, the question immediately arises as to how applicable those data were.
Porosity and permeability
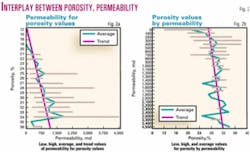
Fig. 2 shows the low, high, and average values and trend line for permeability for each of the porosity values on the left graph and the low, high, and average porosity readings by permeability values in 100 md increments on the right graph.
Where long gaps occurred in the information, the increments involved were eliminated to save space. The low and high values were shown to illustrate how much range there was in data reading for each interval.
On the left graph, permeability increased with increased porosity. Widest range of permeability values was from 367 to 4,500 md in five reservoirs at 34% porosity. Only one permeability value was available at 35% porosity, and only two values were available at 38% porosity. On the right graph, porosity increased somewhat with an increase in permeability. Widest range of porosity was 12-28% at 0-100 md.
Differences between the low and high readings of permeability for each porosity value and the low and high readings of porosity for the average permeability values show how important the averages values may or may not be.
Between 12% and 38% porosity there were 20 values. Of these, six or 30% had no difference between the low and high permeability readings, five (15%) had between 100 and 900 md difference, and nine (45%) had more than 1,000 md difference between the low and high permeability values. A total of 28 porosity values were present for the average permeability values. Nine porosities had no difference between the low and high porosity, 13 had differences between 1% and 9% porosity, and six had differences of more than 10% porosity.
Reservoir depth
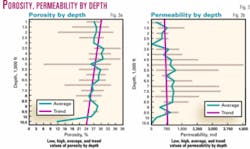
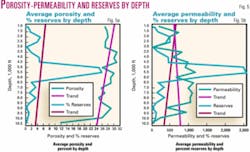
Effect of depth was shown by Fig. 3 where low, high, and average values and trend line for porosity and the low, high, average, average, and values and trend line for permeability were shown by depth in 500-ft intervals.
Depths of reservoirs ranged from 1,000 ft to 10,850 ft with an average depth of 5,457 ft. Of the 133 reservoirs, 19 (14%) were at depths of 5,000-5,500 ft, 19 (14%) were at depths of 5,500-6,000 ft, and 13 (10%) were at depths of 4,500-5,000 ft. This means that 51 reservoirs (38%) were concentrated between 4,500 and 6,000 ft.
Highest average porosity was 33% in 13 reservoirs at depths of 4,500-5,000 ft. Largest range of porosity was at depths of 5,000-5,500 ft with a range of 6-34% porosity. Highest average permeability was 1,197 md in 19 reservoirs at depths of 5,500-6,000 ft. Largest range of permeability was at 5,000-5,500 ft with a range of 6-4,500 md.
Reserves volumes
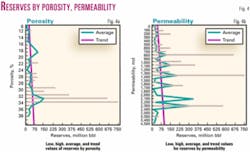
Fig. 4 shows the percent of recoverable reserves by porosity and by average permeability.
As expected, there were more small reservoirs than large ones. There were two reservoirs with reserves of 0-10 million bbl, 50 reservoirs (38% of the total) with reserves of 10-20 million bbl, 9% of the reserves, 24 reservoirs (18%) between 20-30 million bbl with 7% of the reserves, 16 reservoirs between 30-40 million bbl with 7% of the reserves, and 9 reservoirs between 40-50 million bbl with 5% of the reserves.
The eight reservoirs larger than 160 million bbl had only one reservoir each but had 44% of the reserves. The three reservoir sizes between 10-20, 20-30, and 40-50 million bbl had 68% of the reservoirs but only 24% of the reserves.
Highest percent of reserves by porosity was 24% in 16 reservoirs at porosity of 32%. The six porosity intervals between 28% and 33% had 80% of the reserves.
Largest reserve range was 28.7 million bbl to 751 million bbl at porosity of 32%. Reserves by permeability were much more spread out. The six permeability intervals at 200-300 md had 7% of the reserves, 800-900 md had 16% of the reserves, 1,000-1,100 md had 5.8% of the reserves, 1,100-1,200 had 6% of the reserves, 1,400-1,500 md had 11% of the reserves, and 2,300-2,400 md had 8% of the reserves for a total of 54% of the reserves.
Largest reserve range was 12.6 million bbl to 751 million bbl at permeability of 1,400-1,500 md.
Depth and reserves
Fig. 5 shows average porosity and percent recoverable reserves and average permeability and percent recoverable reserves by depth.
Percent of reserves gradually increased until they reached 25% at depths of 5,000-5,500 ft and 26% at depths of 5,500-6,000 ft. At the depth of 5,500-6,000 ft average porosity was 30% with a range from 22% to 33% porosity and average permeability was 1,197 md with a range from 214 to 3,300 md. Reserves in the 5,500-6,000 ft range ranged from 11.5 million bbl to 579 million bbl with an average of 104.8 million bbl in 19 reservoirs.
Four reservoirs in this range had over 100 million bbl of reserves.
Reserve size
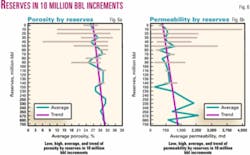
Fig. 6 shows the low, high, and average values and trend line by porosity and permeability for the reservoirs by reserve size in 10 million bbl increments.
This graph shows overall reserves increased with increased porosity and with increased permeability. This is largely the result of 13 reservoirs with over 100 million bbl of reserves. Two of these reservoirs had 28% porosity, two had 28% porosity, three had 31% porosity, three had 32% porosity, and one had 33% porosity.
The 13 reservoirs with over 100 million bbl reserves were also concentrated by permeability as eight of the reservoirs above 150 million bbl were single reservoirs at different reserve sizes, two reservoirs were at 110-120 million bbl, and three reservoirs were at 140-150 million bbl.
Oil column thickness
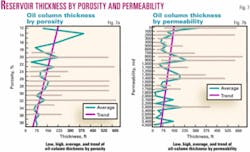
Fig. 7 shows the low, high, and average oil column thickness values and trend line for increased porosity and for increased permeability.
Average oil column thickness was 120 ft and decreased both with increased porosity and increased permeability.
Largest interval was in porosity of 31% with a range from 20 ft to 625 ft. Largest range in oil column thickness for permeability was in the 800-900 md permeability interval with a range from 60-625 ft.
Water saturation
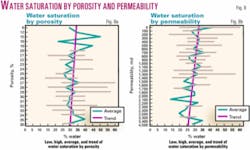
Fig. 8 shows the low, high, and average values and trend line for percent water saturation for increased porosity and for increased permeability.
Average water saturation was 31%, and the percent water saturation decreased as porosity and permeability increased.
Largest water saturation was in the 28% porosity interval with a range of 24-60% water. The largest range of water saturation in permeability was in the 200-300 md permeability interval with a range of 13-55%.
API gravity
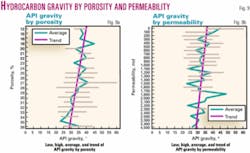
Fig. 9 shows the low, high, and average values and trend line for API gravity for increases in porosity and for increases in permeability.
Average gravity was 45° and decreased as porosity and permeability increased. Largest range of gravity was in the 27% porosity interval with a range of 25-60%. Largest range in gravity with permeability was in the 0-100 md interval with a range from 35-60%.
Gas-oil ratio
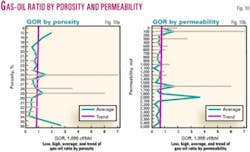
Fig. 10 shows the low, high, and average values and trend line for gas-oil ratios for changing porosity and permeability values.
Average GOR was 730 and decreased slightly with increased porosity and increased permeability. Largest range of GOR by porosity was in the 25% porosity interval with a range of 230 to 7,008. Largest range of GOR by permeability was in the 100-200 md interval with a range from 250-7,008.
Reservoir pressure
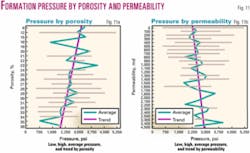
Fig. 11 shows low, high, and average values and trend line for reservoir pressure by porosity and permeability.
Average reservoir pressure was 874 psi and decreased with increased porosity but increased with increased permeability. Largest range of pressure by porosity was in the 12% interval with a range of 778 psi to 5,203 psi. Largest range of pressures was in the 0-100 md permeability interval with a range of 778 to 5,203 psi.
Reservoir temperature
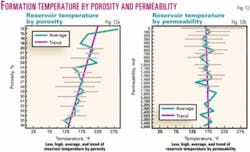
Fig. 12 shows the low, high, and average values and trend line for reservoir temperatures by increases in porosity and permeability.
Average temperature was 67° F. and decreased with increased porosity but increased slightly with increased permeability. Largest ranges in temperatures were in the 28% porosity interval with a range of 92-214°. Largest range of temperatures for changes in permeability was in the 0-100 md permeability interval with a range of 92-283° F.
What it all means
There was an increase in the number of reservoirs as porosity increased and a decrease in the number of reservoirs as permeability increased, more permeability values with higher porosity readings and more porosity values with lower permeability readings.
Average permeability increased with an increase in porosity, and the ranges of low and high permeability increased with an increase in porosity. Average porosity increased slightly with an increase in permeability, although eight of the ten highest permeability intervals had only one porosity reading each, and two permeability intervals had only two porosity readings each. With so few values at the higher points, it is difficult to say if this was a true reading or merely the result of scarce data.
The percent of reserves increased with increased porosity, and the percent of reserves decreased with increased average permeability. Porosity and permeability increased as reserve size increased.
The largest reserves were in reservoirs with 32% porosity and permeability of 800-900 md. It was obvious that high permeability was not as important as other factors in the accumulation of large reserves. It has been suggested that the amount of proved acreage was more important than high permeability.
Porosity decreased with depth, and permeability increased with depth. Percent of reserves increased to a maximum at 5,500-6,000 ft and then decreased rapidly, so there was an overall decrease in reserves with an increase in depth.
Examining other reservoirs and fluid properties with changes in porosity and permeability show that thickness, percent water saturation, API gravity, and gas-oil ratio all decreased with increased porosity and permeability, pressure decreased with increased porosity and increased with increased permeability, and temperature decreased with increased porosity but remained basically the same with increased permeability. The effect of such changes on reservoir calculations may be larger than previously realized.
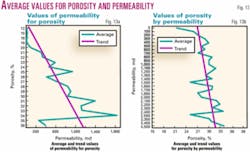
The wide ranges of low and high values in all reservoir measurements make it difficult to find or predict relationships between porosity and permeability. There appear to be much less relationships between the two properties than had been assumed. Fig. 13 shows the average permeability and trend for porosity values and average porosity and trend for permeability values. The conversion from porosity to average permeability, the left figure on the graph, might have some potential for correlation as long as it is remembered that extreme ranges were not shown and only averages were considered. Differences should be expected because of the wide range of low and high values. Variations for porosity on the right graph go only from 27% to 32% and are too small to be of help.
Bibliography
Galloway, W.E., Ewing, T.E., Garrett, C.M., Taylor, N., and Bebout, D.G., "Atlas of Major Texas Oil Reservoirs," Bureau of Economic Geology, Austin, 1983.
Haeberle, F.R., "Study of reservoir properties can yield exploration clues," OGJ, June 21, 1999, pp. 62-65.
Haeberle, F.R., "How reservoir property variations may effect Frio hydrocarbon volumes, OGJ, Oct. 15, 2001, pp. 30-38.
Haeberle, F.R., "Reservoir property analysis can guide Texas Gulf Coast exploration, OGJ, Feb. 17, 2003, pp. 38-43.
Landes, K.K., "Petroleum Geology of the United States," Wiley Interscience, 1970, pp. 219-282.
The author
F.R. Haeberle ([email protected]) is a consulting geologist who moved to Delaware, Ohio, after 20 years in Dallas. He has worked for Standard Oil Co. of Texas, Atlantic Refining Co., Mobil Oil Corp., Mayfair Minerals, and J.J. Lynn Oil Division. He holds BS and MS degrees in geology from Yale University and an MBA degree in finance from Columbia University Graduate Business School.
