Paul Bjacek
SRI Consulting
Houston
A new forecasting methodology differs from the conventional belief that operating rates are important indicators in petrochemical margin forecasts. This new method predicts that petrochemical margins will improve in 2003.
SRI Consulting Inc. (SRIC) believes that product price movements are primarily related to a combination of changes in feedstock costs and market conditions. Price variability typically depends on cost swings, such as changes in the price of oil and gas.
The price movement increment most important to producers—margin—depends more purely on market conditions; specifically supply and demand. Our latest analyses use this theory.
An advantage with this approach is a better calculation of supply and demand, which results in a better forecast based on a set of assumptions.
These factors can affect the price levels on an industry supply-cost curve:
These factors can occur together and each can affect margins to a varying degree. These factors are typically not reflected in regional operating rates.
Supply, demand definition
Many margin forecasts use operating rates to indicate market conditions. This method is inadequate because producers can increase plant-operating rates and divert product to export markets at lower prices when demand is low.
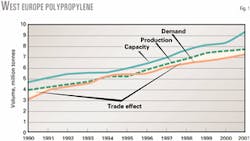
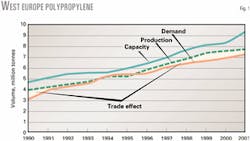
Alternatively, when rates are in the high 90%s, operators can import more material at higher prices. We call this the "trade effect."
Fig. 1 shows the trade effect for polypropylene in Western Europe.
The trade effect is another factor that affects pricing and is not reflected in the capacity utilization rate. Conversely, trade alone cannot explain margin changes; one should apply it in the context of domestic market conditions.
The trade effect impacts margins because:
We feel that domestic capacity minus demand best accounts for the surplus or shortage in any regional market.
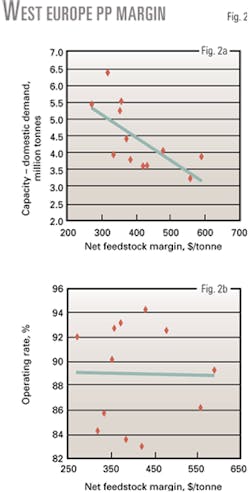
The two graphs in Fig. 2 compare polypropylene margins to capacity minus domestic demand and operating rates for Western Europe.
The correlation of capacity minus demand is better than capacity utilization, which is negligible. This indicator encompasses trade flow, inventory changes, and operating rate effects.
Capacity minus demand is not the only guideline for margin determination. Other factors such as technology trends and government regulations also affect margins and can vary significantly for different products.
We do not quantitatively calculate net feedstock margins using a correlation equation approach but use it as a predictor of the direction of net margin.
Supply, demand calculations
The accuracy of any margin forecast depends primarily upon the accuracy of the supply-demand forecast. This, in turn, depends on supply-demand forecasting methodology and assumptions.
Forecasters should base capacity minus demand forecasts on the chain analyses of final derivatives supply-demand first. We do this for every country in the world for a complete, balanced global product supply-demand outlook.
The resulting derivative production calculation determines demand or coproduct production for the next chemical(s) in the chain, progressing upstream.
This process continues until the base chemicals and refined products supply-demand balances are complete. When appropriate, we adjust downstream forecasts for potential reverse impacts from the upstream portion of the chain.
A complete supply-chain analysis is critical for an accurate margin forecast. Forecasters must specifically understand the impact of deviations on different supply-chain variables.
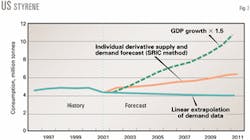
Common alternatives to a bottom-up demand calculation include the inappropriate "GDP coefficient" or "extrapolation" methods, both of which ignore supply dynamics downstream of the analyzed product.
Fig. 3 shows a comparison of three forecasting methods; these forecasts can vary widely.
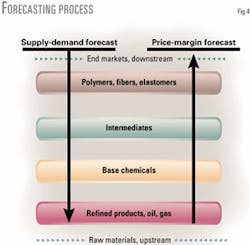
Fig. 4 shows the forecasting process. The flow is demand driven; forecasting should begin with end markets and products and end with base raw materials.
Prices and margins are then forecast, based on a buildup of projected energy costs and previously forecast market trends.
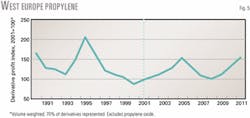
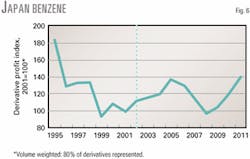
Figs. 5 and 6 show some aggregated results from using the new method. Fig. 5 shows the volume weighted average propylene derivative margin in Europe and Fig. 6 shows volume weighted average benzene derivative margin in Asia. Both graphs reflect an anticipated rebound in margins in 2003, with a peak in 2004-05, followed by another margin downturn around 2008.
The author Paul Bjacek is the world petrochemical director at SRI Consulting, Houston. He has also served as a business research manager for Chevron Chemical Co. and in consulting positions with Ernst & Young LLP, Chem Systems, and The WEFA Group. Bjacek holds an MS in sea law, economics, and policy from the London School of Economics and a BS in chemistry and business from the University of Scranton, Pa. He is also a past president of the Commercial Development and Marketing Association.
