Method developed to determine interfacial diffusion of H2S slugs in gas pipeline
Based on a presentation to the 4th International Pipeline Conference, Sept. 29-Oct. 3, 2002, Calgary.
The research described here examined the fate of H2S-contaminated natural gas slugs as they travel through a gas pipeline network. The important phenomenon that affects the spread of the H2S slug as it travels downstream of a pipe is the diffusion with the sweet gas at the front and back interfaces of the slug.
The research determined that the diffusivity constant (D) used in calculating the interface spread varies along the pipeline, which prohibits use of a closed-form solution of the Fick's law equation. An effective time parameter was introduced to account for the variation in the diffusivity in a "marching in time" scheme of solution.
The consequent model, described here, demonstrated the effects of pipe diameter, mean flow velocity, and pipe internal roughness on the contamination spread.
A test loop has also been constructed to validate the diffusion coefficient in gaseous flows. Excellent agreement was obtained between the measured and predicted results. The mean error in predicting the interface spread was approximately 6.2%.
Turbulent flow
Upsets in natural gas plants often produce volumes of gases with concentrations of H2S beyond the maximum threshold allowed, typically 16 ppm (vol). Gas analyzers in the meter station at gas receipt points are used to detect such upsets and react accordingly, depending on the degree of the upset.
Typically, a concentration of H2S exceeding 17.6 ppm triggers an alarm and, depending on the control logic, it might take 1 to 5 min to activate the shutdown of the isolation valve. In other cases, it may take much longer.
During this period, a volume of sour gas with a certain concentration of H2S is introduced into the pipeline lateral and subsequently into the mainline.
To examine the fate of these H2S slugs as they travel through a pipeline network under normal operating conditions, this research first modeled the slug through a straight length of pipeline. The important phenomenon that affects the spread of the H2S slug as it travels downstream of a pipe is the diffusion with the sweet gas at the front and back interfaces of the slug.
The literature contains several key theories dealing with turbulent diffusion between batches in a pipeline
Austin and Palfrey examined turbulent flow in pipelines with the intent of deriving empirical relationships between the length of the mixed region between the leading and trailing interface in a pipeline and select dimensionless flow characteristics, primarily Reynolds number.1
Primary factors affecting the length of the mixed region were considered as distance traveled along pipeline, viscosity and density of the two products, relative roughness of the pipe, mean flow velocity, pipe ID, and the intensity of turbulence.
The authors listed the factors that have been found by experience to increase the level of mixing between two batches in a pipeline. These are laminar flow at start-up of a pumping operation; slow valve switching from the leading product to the trailing product; sharp bends and other complicated piping features; and passage through filters, which can lead to a brief section of laminar flow.
Austin and Palfrey also discussed the idea of molecular diffusion contributing to the extent of mixing. But they discarded it as having no significant effect based on various observations. They also discussed an observed phenomenon they called a "tail effect," which describes the asymmetry found in the concentration profile of trailing product in leading product. This effect is not accounted for in most equations describing the concentration profile of an interface in serial pipeline flow.
Levenspiel reaffirmed the notion that in turbulent pipe flow molecular diffusion does not affect the extent of mixing to any appreciable amount.2 Songsheng and Jianing developed equations that are used in a 2D finite difference method, which predicted the "tail effect" observed earlier by Austin and Palfrey.3
Sherwood examined key theories developed in the topic area of axial dispersion in pipelines. The authors reaffirmed that dispersion is greater if flow is laminar by stating that an increased velocity gradient increases axial dispersion. They also discussed a paper by Taylor, where it was determined that given a specific velocity profile, the effective axial dispersion coefficient can be found.4
Using a "universal velocity profile," Taylor arrives at the relationship shown in Equation 1 (accompanying equations box)5 which is valid for Re > 10,000. The Fanning friction factor is a function of Reynolds number or the relative roughness of the pipe being considered and can be determined from a derivative of Colebrook-White equation in explicit form (Equation 2).6
For Reynolds numbers less than the threshold for Taylor's turbulent diffusion equation (Equation 1), Tichacek provided data for 2000 < Re < 20,000.7 A least-square fit of these data resulted in Equation 3.
For laminar flows (Re < 2,000), Taylor provided a relationship that also depends on the Schmidt number in the form of Equation 4.8
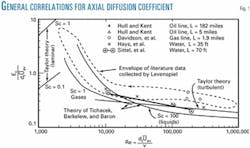
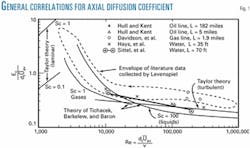
Fig. 1 gives all these correlations that relate the effective axial diffusion coefficient.4 (In Fig. 1, D is noted as Ec.)
Effective time method
The concentration profile across an interface between different fluids in a pipeline has been derived (OGJ, Feb. 13, 1984, p. 112) and takes the form of Equation 5.
To make this diffusion equation specific to pipeline problems where the mean flow velocity is known, the time (t) can be replaced with the length of pipeline traveled (L) divided by the mean velocity of flow in the pipeline (U). Hence Equation 5 becomes Equation 6.
This equation does not allow for the diffusivity constant (D) to vary with time. As preliminary work showed, the value of this "constant" can increase from 0.4 to 0.9 (sq m/sec) over the length of the pipeline. The degree of this variation was significant enough to warrant further investigation of possible alternative methods.
There were several alternatives considered:
- Allow the diffusivity to be a function of time in the original derivation of Equation 5 and attempt to solve the fundamental equations to obtain a new relationship.
- Determine the time or spatial average of the diffusivity constant and use this in Equation 5.
- Introduce an effective time parameter to account for the variation in the diffusivity and use Equation 5 with this new time parameter in a marching-in-time scheme of solution.
The third method was adopted in the present work, which we called the "Effective Time Method."
In this method, the diffusivity could be assumed to be constant during a small increment in time but is allowed to vary in a step-wise manner in time. Equations 5 and 6 assume that at t = 0, the concentration profile is a step function where c(x, 0) = 1 for x < 0 and c(x, 0) = 0 for x > 0.
This is where the problem lies: The starting concentration profile (at t = 0) of the diffusion process described by Equation 5 must be a step function and the diffusivity must remain constant. This, of course, is not the case downstream the pipeline where the concentration profile continues to flatten out.
The following theory and example explain the reasoning behind the Effective Time Method proposed and how it accounts for this problem.
Consider a situation in which a concentration interface diffuses with a diffusion coefficient D1 for a time (delta)t1. The diffusion coefficient then changes to D2 during a next time step (delta)t2. The total elapsed time is ((delta)t1+(delta)t2).
Still to make use of Equation 5 would require finding an effective time for use in the second step. This effective time will be set in a way that allows D2 to be used throughout, by making the starting point of the step from (delta)t1 to (delta)t1+(delta)t2 the correct shape.
If one can determine the time required using D2 to reach the same concentration profile obtained using D1 and (delta)t1 and then add (delta)t2 to that time, we will have an effective time value that we can use to find the concentration profile at the end of (delta)t2.
In other words, we would have Equation 5a. Analyzing this statement using Equation 5 yields Equation 7.
This equation must be true for all values of x. Hence Equation 8 follows. The effective time that can therefore be used to find the concentration profile at time = (delta)t1 + (delta)t2 is shown in Equation 9 and the concentration profile at (delta)t1 + (delta)t2 becomes as shown in Equation 10.
This method is demonstrated by the following numerical example:
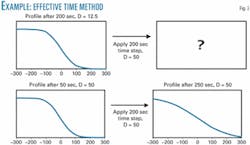
Consider a system that undergoes diffusion for 400 sec. For the first 200 sec, the diffusivity is 12.5 sq m/sec and for the next 200 sec the diffusivity is 50 sq m/sec. According to the proposed method, the first time step will be adjusted as shown in the accompanying example box (p. xx).
Obtaining the final concentration profile after 400 sec requires that Equation 5 be applied for a system in which the diffusivity is constantly 50 and total effective time of 50 + 200 sec (250 sec). Fig. 2 shows how this procedure is accomplished.
The general form of this method for use in computer algorithms can be summarized by the equations that make up Equation 11.
Model development
A model using Excel 97 and Visual Basic for applications will determine the fate of a slug as it travels through a straight section of pipeline. Once the iteration converged and the pressure was known at a given location along the pipeline, AGA8 equation of state was used to determine the necessary physical properties (density, viscosity, etc.).
A dynamic linked library (DLL) file was developed in-house that can be used in conjunction with macros in Excel to determine these properties quickly for a set of pressure and temperature values. Diffusivity is calculated with one of the three equations presented, Equations 1, 3, or 4, depending on the value of Reynolds number.
A numerical investigation determined the effects of pipe diameter, flow rate, and pipe roughness on the spread of the mixing zone between a spec gas and a slug of gas that contains H2S. The inlet pressure for all of simulation cases was set to 7,000 kPa, while the operating temperature was set to 5° C. and the flow was assumed isothermal.
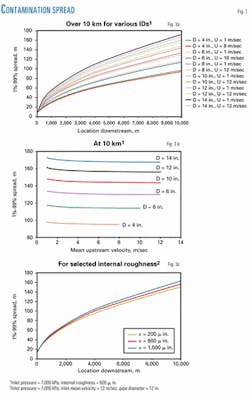
A pipeline length was taken to be 10 km with the interval length set to 10 m. Pipe IDs were selected to be 4, 6, 8, 10, 12, and 14 in. and flow rates corresponded to inlet velocities of 1, 2, 4, 5, 7, 8, 10, and 12 m/sec. Fig. 3 shows the results.
Fig. 3a demonstrates the effect of the pipe diameter on the contamination spread, showing that, as pipe diameter increases, spread length also increases. This effect does not appear to be affected by mean inlet velocity to a great extent. For a particular diameter, however, a slight increase in mixing is observed for slower velocities.
Fig. 3b elaborates on the effects observed in Fig. 3 by plotting data obtained at the end of the 10-km section of the pipeline. Again increasing diameter is shown significantly to increase the contamination spread length.
Notice also the effect of decreasing the mean flow velocity, causing an increase in mixing length. Fig. 1 suggests that decreasing the velocity even further will cause more significant increases in the mixing length.
Fig. 3c shows the effects of pipe internal roughness on the contamination spread and that increasing pipe roughness increases the spread, although only slightly. The increase in frictional losses is most likely more significant than the increase in spread.
To summarize, if increased mixing is a desired effect, then wherever possible a combination of a large-diameter with a low flow rate should be considered. This is perhaps why "sour slug bottles" are frequently used downstream on the pipe lateral of a gas processing plant. These bottles are merely large diameter pipes with the primary purpose of holding the sour-slug volume close to the gas plant to be pulled-back once detected and secondly to allow diffusion of the sour slug gradually into the sweet gas at the interface.
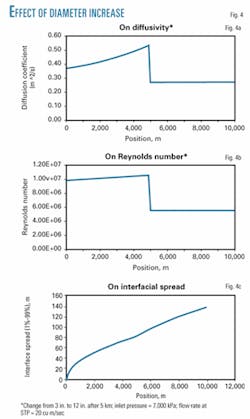
In order to demonstrate the effect of a sour bottle, a numerical example was considered in which a pipeline 10 km in length underwent a diameter change at 5 km from 3 in. to 12 in. Inlet pressure was 7,000 kPa and operating temperature was 5° C. Flow rate was set to 20 sq m/sec standard temperature and pressure (STP) and output data were plotted.
Fig. 4a plots the diffusivity vs. the position downstream of the inlet. As velocity increases through the narrow section of the pipeline, so does diffusivity. When the increase in diameter is met, the velocity suddenly decreases and so does the diffusivity. This result is explained when Reynolds number through the test run is plotted.
Fig. 4b demonstrates that this particular simulation was conducted in the highly turbulent region, where D/Ud is a very weak function of Reynolds number (Fig. 1). Since the decrease in velocity did not result in a significant change in D/Ud, diffusivity decreased.
Fig. 4c plots the interface spread vs. the location downstream. The interface spread is defined as the length between the point where the concentration is 99% leading product and the point where the concentration is 99% trailing product (1% leading product). It is defined by the final equation in Equation 11, derived from Equation 5.
The rate at which the spread grows vs. distance clearly increases at the point where the diameter increases.
Verification
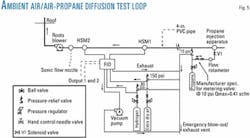
A laboratory-scale test loop was constructed to determine experimentally the contamination profile at the leading side of a batch of a similar gas in pipe flow. The main gas in this test loop is ambient air drawn in to the loop by a Roots blower, while the batch is also ambient air with a slight amount of propane tracer.
The test loop (Fig. 5) consists of a 57 m long PVC pipe (102.3 mm ID), a propane-injection system upstream, and two hydrocarbon sampling modules (HSM1 and HSM2) downstream at locations shown in Fig 9. Steady flow of air is established by means of a choked sonic nozzle of certain throat diameter at the far downstream end and immediately upstream of the blower.
A flame ionization detector (FID) samples the flow (in real-time) at the two sample ports 20.6 m apart for hydrocarbon content. The first port is 30 m downstream of the propane-injection point.
The propane-injection system consists of a solenoid valve (normally closed) controlled by the pressure-output signal from the sonic flow meters for safety precaution. When the signal from the pressure transducer indicates that steady flow has been established, the solenoid valve can be opened (energized). If the signal for any reason drops, the valve will close (de-energize), and the propane injection will be ceased.
A pressure safety valve attached to the propane regulator in combination with the metering valve attached upstream of the injection device ensures that the maximum propane flow rate is limited to a propane-air concentration of less than 0.42 vol % propane. This value is 20% of the lower explosive limit (LEL) of propane in air. (LEL is 2.1% by volume.)
Propane is injected in repeated batches by opening and closing the solenoid valve in 10-sec intervals in order to establish a leading edge of each batch. The FID system requires a vacuum pump to draw a very minute amount of air from the loop that does not affect the mean flow in the main test section (< 100 cu cm/min).
Hydrogen gas is used as an integral part of the FID detection procedure. Mean flow velocity in the test loop is calculated based on mass flow measurements by the sonic nozzle, the mean pressure in the test loop measured by two Validyne pressure transducers and ambient temperature.
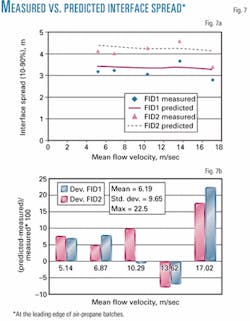
Fig. 6 shows experimental results of five different mean flow-velocity varied from 5 m/sec to 17 m/sec. Only the leading edge of air-propane batches obtained from HSM1 probe are shown in the figures and compared to numerical profiles obtained with the model described earlier.
Fig. 7 shows comparisons between interface spread for each flow velocity, with numerical values of pertinent parameters given in Table 1. It is shown that the mean error between measured and predicted results is approximately 6.2% with maximum error of approximately 22.5%.
Results
The investigation suggests the following conclusions:
- The correlations for axial diffusion coefficient given in Fig. 1, and in Equations 1, 3, and 4 are adequate for use in diffusion problems with gaseous flows.
- If increased mixing is a desired effect, then wherever possible a combination of a large diameter with a low flow rate should be considered. This is perhaps why sour-slug bottles are frequently used downstream on the pipe lateral of a gas processing plant.
These bottles are merely large-diameter pipes with the primary purpose of holding the sour-slug volume close to the gas plant to be pulled back once detected and secondly to allow diffusion of the sour slug gradually into the sweet gas at the interface. - Increasing pipe roughness increases the spread, although only slightly.
- Experimental results of five different mean flow velocities varied from 5 m/sec to 17 m/sec showed good agreement between measured and predicted interface spread within 6.2% mean deviation.
Acknowledgments
The work presented here is part of a research program sponsored by Trans- Canada PipeLines Ltd. and permission to publish it is gratefully acknowledged. Assistance provided by J. O'Blenes and J. Geerligs of NOVA Research and Technology Center in the experimental part is greatly appreciated. The authors also thank Steve Hall, Gord Toews, and Dana Engler at TransCanada PipeLines for their valuable input to the project.
References
- Austin, J.E., and Palfrey, J.R., "Mixing of Miscible but Dissimilar Liquids in Serial Flow in a Pipeline," Proceedings of the Institution of Mechanical Engineers, Vol. 178 (1964), p. 377.
- Levenspiel, O., "Longitudinal Mixing of Fluids Flowing in Circular Pipes," Industrial and Chemical Engineering, Vol. 50 (1958), p. 343.
- Songsheng, D., and Jianing, P., "Application of Convection-Diffusion Equation to the Analyses of Contamination between Batches in Multi-Product Pipeline Transport," Applied Mathematics and Mechanics (English Edition), Vol. 19 (1998), p. 757.
- Sherwood, T.K., et al., Mass Transfer, Chapter 4, New York: McGraw Hill Inc., 1975.
- Taylor, G., "The Dispersion of Matter in Turbulent Flow through a Pipe," Proc. Royal Soc. London, Vol. 223 (1954), p. 446.
- Miller, D.S., Internal Flow Systems, 2nd Edition, Chapter 8, Houston: Gulf Publishing Co., 1990.
- Tichacek, L.J., et al., "Axial Mixing in Pipes," AIChE Journal, Vol. 3 (1957), p. 439.
- Taylor, G. "Dispersion of Soluble Matter in Solvent Flowing Slowly Through a Tube," Proc. Royal Soc. London, Vol. A219 (1953), p. 186.
The authors
Daniel Sennhauser (sennhad@ novachem.com) began working at NOVA Research and Technology Center, Calgary, in 2001 on various research projects including H2S slug diffusion, genetic algorithm-based optimization of pipeline systems, and semi-closed compression cycles for mitigation of CO2 emissions. He graduated from the University of Calgary (with distinction; 2001) in mechanical engineering and is a recipient of the APEGGA (Association of Professional Engineers Geologists and Geophysicists of Alberta) Gold Medal in Mechanical Engineering.
Kamal Botros ([email protected]) is a research fellow of fluid dynamics with NOVA Research & Technology Corp. where he has worked since 1984. Previously, he was an assistant professor of mechanical engineering at the University of Calgary, specializing in thermofluids. Over 25 years, he has worked on various fluid flow equipment dynamic problems related to oil and gas processing and transportation facilities, as well olefins and polyolefins manufacturing plants. Botros holds a PhD in mechanical engineering from the University of Calgary and is a registered professional engineer in Alberta and an associate member of ASME.
Trent van Egmond is a senior engineer in the gas quality department with TransCanada Pipelines Ltd., currently managing implementation of a CO2 management service. He has been with the company since 1991. Previously, he was an operations engineer with Enbridge Pipelines Inc. and with Peace Pipe Lines Ltd. Over the past 22 years, he has worked in the pipeline design, project management, construction, and operations including 10 years in international project development. Van Egmond holds a BSc in civil engineering from the University of Calgary is a registered professional engineer in Alberta and a member of ASME and NACE.
