Reservoir property analysis can guide Texas Gulf Coast exploration
The question is often asked as to what influence changes in reservoir properties may have on the number of reservoirs and the percent of recoverable reserves in oil field reservoirs.
Commonly available reservoir properties include depth, porosity, permeability, oil-column thickness, pressure, temperature, API gravity, gas-oil ratios, and water saturation. Nothing is said or inferred as to the causes of change in these properties. Unfortunately, data on what may be the most important property, proved acreage, is available on several fields but not on most reservoirs.
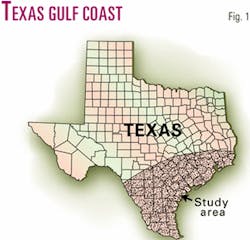
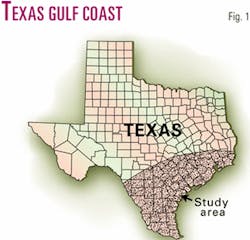
The area reviewed for this study is onshore Texas along the Gulf of Mexico with 133 reservoirs in 110 fields (Fig. 1). Recoverable reserves in these reservoirs totaled 7.5 billion bbl. All reservoirs were sandstones, and reservoir ages ranged from Cretaceous, Paleocene, Eocene, and Oligocene.
Reservoirs and reserves
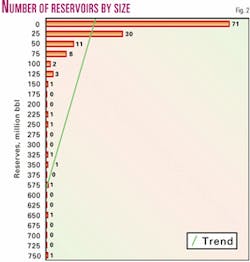
Fig. 2 shows the number of reservoirs in intervals of 25 million bbl of reserves. Seventy-one reservoirs were between 0 and 25 million bbl, followed by 30 reservoirs at 25-50 million bbl. Only one reservoir was present in each reserve size above 50-175 million bbl.
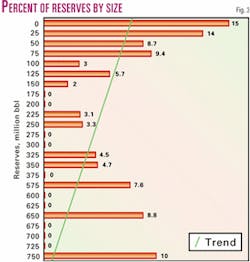
Fig. 3 shows the percent of recoverable reserves available in each 25 million bbl interval. The reserves ranged from 6.5 million to 751 million bbl with an average size of 56.9 million. The largest total reserves were 1.1 billion bbl, 15% of the total, in the 71 reservoirs in the 0-25 million bbl interval followed by 1 billion bbl, 14% of the total, in the 30 reservoirs in the 25-50 million bbl interval. One reservoir in the 750-775 million bbl interval had a total of 10% of the reserves, and one reservoir in the 650-775 million bbl interval has 9% of the recoverable reserves.
Depth factors
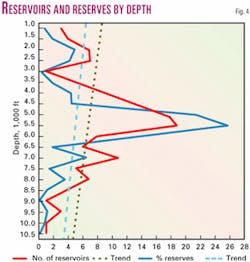
Fig. 4 shows the number of reservoirs and percent of reserves plotted by depth in intervals of 500 ft. The 133 reservoirs ranged in depth from 1,000 ft to 10,850 ft with an average depth of 5,457 ft.
Nineteen reservoirs, 14%, were in the 5,000-5,500 ft depth interval with 25% of the reserves and an average depth of 5,247 ft. Another 19 reservoirs were in the 5,500-6,000 ft interval with 26% of the reserves and an average depth of 5,721 ft.
Three reservoirs with less than 1% of the reserves were in the 1,000-1,500 ft interval, one reservoir with less than 1% of the total reserves was in the 10,000-10,500 ft interval, and one reservoir with less than 1% of the reserves was in the 10,500-11,000 ft interval.
Largest reserves were 751 million bbl in the 5,000-5,500 ft depth interval followed by 663 million bbl in the 6,000-6,500 ft interval. Smallest reserves were 6.5 million bbl in the 8,500-9,000 ft interval followed by 9 million bbl reserves in the 9,000-9,500 ft interval.
A giant oil field has been defined as one that has produced or will produce at least 100 million bbl of oil. Thirteen reservoirs in this area, 10% of the total, had more than 100 million bbl ultimate reserves with a total of 3.9 billion bbl reserves, 53% of the total reserves, an average size of 306 million bbl, and an average depth of 5,453 ft. The 120 reservoirs, 90% of the total, with less than 100 million bbl of reserves had a total of 3.5 billion bbl reserves, 47% of the total reserves, with an average size of 29.9 million bbl, had almost the same average depth of 5,457 ft.
One of the reservoirs with over 100 million bbl of reserves was in the 2,000-2,500 ft depth interval, compared with six reservoirs in the same interval with less than 100 million bbl of reserves. One reservoir was in the 4,000-4,500 ft interval, compared with eight reservoirs with less than 100 million bbl of reserves.
Four reservoirs in the 5,000-5,500 ft interval had more than 100 million bbl of reserves, compared with 15 reservoirs in the same interval with less. Four reservoirs in the 5,500-6,000 ft interval had more than 100 million bbl of reserves compared with 15 reservoirs with less.
Two reservoirs in the 6,000-6,500 ft interval had reserves of over 100 million bbl, compared with 6 reservoirs with less. One reservoir in the 8,000-8,500 ft interval had over 100 million bbl of reserves, compared with 6 reservoirs with less.
Largest reserves, over one-half the reserves were concentrated in the depths between 5,000 and 6,000 ft, near the central part of the depth scale. These figures point out fairways by depth for the discovery of maximum reserves.
Reservoir content
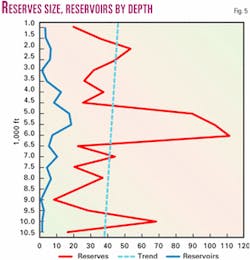
Fig. 5 shows the average size of reservoirs in millions of barrels by depth, total reserves divided by the number of reservoirs at that depth. Scale is different from Fig. 4 accounting for the different appearance in reservoir sizes. Overall average size of the reserves in the area was 56.9 million bbl.
The average size irregularly increased until a depth of 6,000-6,500 ft was reached, then irregularly decreased until an average size of 69 million bbl was reached in one reservoir at a depth of 10,000-10,500 ft. High readings in seven reservoirs in the 2,000-2,500 ft interval, 18 reservoirs in the 5,000-5,500 ft interval, 19 reservoirs in the 5,500-6,000 interval, and 8 reservoirs in the 6,000-6,500 ft interval were largely the results of the reservoirs with over 100 million bbl.
Largest average reserves were in eight reservoirs in the 6,000-6,500 ft interval with an average size of 112.5 million bbl.
Porosity values
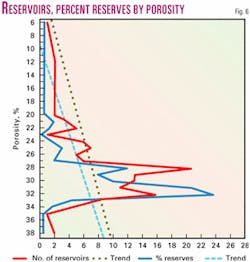
Fig. 6 shows the number of reservoirs and percent of reserves plotted by porosity. Data for 132 reservoirs had porosity values recorded with porosity ranging from 6% to 38% with an average of 28%.
Twenty-one reservoirs, 16%, had porosity in the 28% interval with 12% of the reserves. Largest reserves of 751 million bbl were in one reservoir with porosity of 32%. Smallest reserves of 6.5 million bbl were in one reservoir with porosity of 23% and reserves of 9 million bbl were in one reservoir with porosity of 29%. Largest average reserves of 141.7 million bbl were in 11 reservoirs with porosity of 31%.
The 13 reservoirs with over 100 million bbl of reserves were in reservoirs with porosity ranging from 28% to 32%. None was found below 28% porosity and none above 32% porosity.
Exploration efforts need not be undertaken in areas with less than 23% porosity or more than 33% porosity. Largest number of reservoirs and percent of reserves were in the areas of higher porosity.
Permeability data
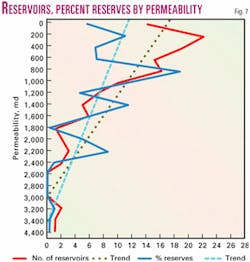
Fig. 7 shows the permeability in intervals of 200 md and the number of reservoirs and the percent of reserves for each interval. Permeability values were recorded for 126 reservoirs with a range of 3 to 4,500 md and an average of 874 md.
Twenty-two reservoirs, 18% of the total reservoirs with 11% of the reserves, had permeability between 200-400 md. Average permeability in this interval was 288 md. Largest percent of reserves was in the 800-1,000 md interval with 19% of the reserves. Average permeability in this interval was 863 md.
Largest reserves of 751 million bbl were in one reservoir with permeability of 1,400-1,600 md followed by one reservoir with reserves of 663 million bbl in a reservoir with permeability of 800-1,000 md. Largest average reserves were in five reservoirs with permeability between 1,400-1,600 md.
The 13 reservoirs with over 100 million bbl of reserves were found in reservoirs with permeability ranging from 200 md to 2,350 md.
Exploration should be concentrated in areas with permeability less than 2,350 md. Largest number of reservoirs and percent of reserves were in the zones of lower permeability.
Pressure spread
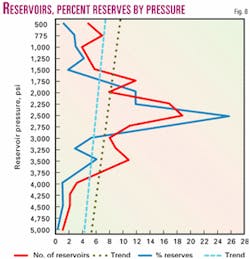
Fig. 8 shows the number of reservoirs and the percent of reserves by pressure in intervals of 250 psi. One hundred and thirty reservoirs had pressure data available with pressures ranging from 575 to 5,203 psi and averaging 2,485 psi.
Nineteen reservoirs were in the 2,500-2,750 psi interval with 26% of the reserves and average pressures of 2,612 psi. This was followed by 14% of the total reserves in the 2,750-3,000 psi interval in 11 reservoirs with an average pressure of 2,847 psi.
Largest reserves of 751 million bbl were in the 2,000-2,250 psi interval followed by 663 million bbl in the 2,250-2,500 psi interval. Largest average reserves were 111.9 million bbl in the 2,000-2,250 psi interval.
The 13 reservoirs with over 100 million bbl reservoirs had pressures ranging from 1,400 psi to 3,800 psi. Only 2 were below 2,000 psi.
Little exploration effort is necessary in areas where pressure is below 2,250 psi or above 3,800 psi. Largest number of reservoirs and percent of reserves were in the middle intervals of pressure.
Temperatures
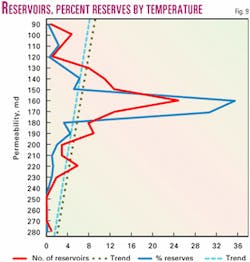
Fig. 9 shows temperatures plotted in intervals of 10° F. and the number of reservoirs and the percent of recoverable reserves for each interval. Temperatures for the 113 reservoirs recorded ranged from 90° F. to 283° F. with an average of 167° F.
Twenty-five temperatures, 22%, were in 160-170° range with 36% of the reserves and an average temperature of 164°.
Most reserves were 36% in the 160-170° interval. Largest average reserves were 159 million bbl in 13 reservoirs in the 170-180° interval.
Temperature in the reservoirs with over 100 million bbl reserves ranged from 160-190° except for one reservoir with a temperature of 140°.
No more than 2% of the reserves were found in temperature intervals below 130° or above 200°. Most reserves were in areas where formation temperature was between 140° and 200°. Largest number of reservoirs and percent of reserves were in the middle intervals of temperature ranges.
Oil gravity
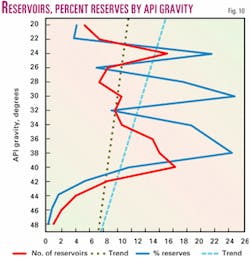
The number of reservoirs and the percent of recoverable reserves are shown in Fig. 10 for gravity readings in intervals of 2°. A total of 133 API gravity readings were available from 20° to 60° API with an average API gravity of 34°.
The largest number of reservoirs was 17, 13% of the total, in the 40-42° interval with 11% of the reserves at the same average gravity. Largest percent of reserves was 25% in the 30-31° interval with an average gravity of 31°.
Largest reserves of 751 million bbl were in the 38-39° gravity interval and 663 million bbl were in the 30-31° gravity interval. Largest average reserves were 113.9 million bbl with 28-29° gravity. All average reserves in intervals below 22-23° and above 48-49° gravity were less than 20 million bbl.
The API gravity in reservoirs with over 100 million bbl reserves ranged from 24-38°.
Results from exploration efforts in areas with less than 22° gravity or more than 42° gravity were not very successful. With the exception of areas of very high gravity, reservoirs and percent reserves were scattered throughout the low and middle areas of gravity readings.
Reserves by GOR
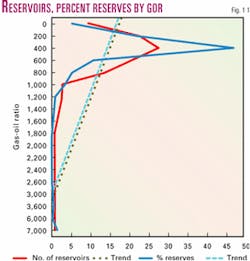
Fig. 11 shows the gas-oil ratio plotted in ratios of 200 with the number of reservoirs and the percent of recoverable reserves. There were 108 GOR readings recorded varying from 10 to 7,008 with an average of 723.
Twenty-eight reservoirs, 26% of the total, were in the interval of 400-600 GOR with 47.5% of the reserves and an average GOR of 499.
Largest reserves of 751 million bbl were in the 400-600 GOR interval. Largest average reserve value of 107 million bbl was in the 28 reservoirs in the 400-600 GOR interval.
The gas-oil ratios in the reservoirs with over 100 million bbl reserves ranged from 120-1,030. All the high numbers of reservoirs and percent of reserves were in areas where the gas-oil ratios were low, generally less than 1,000.
Water saturation
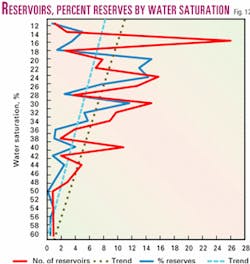
Fig. 12 shows the number of reservoirs and the percent of recoverable reserves plotted in 2% intervals for water saturation. Water saturation for 133 reservoirs ranged from 12% to 61% and averaged 31%.
Largest number of reservoirs, 16 or 13% of the total, was in the 24-25% water saturation interval with 15% of the reserves and an average water saturation of 24%. An additional 15% of the reserves was in eight reservoirs with 20-21% water saturation.
Largest reserves of 751 million bbl were in the interval with 22-23% water saturation followed by reserves of 663 million bbl in the 20-21% interval. Largest average reserves were 137.2 million bbl in the 22-23% interval.
Water saturation in the 13 large reservoirs ranged from 14-35%. Exploration results where water saturation was above 46% were not very successful. In the areas between 18% and 46% water saturation lows in the number of reservoirs and the percent of reserves were found at three intervals, 28-29%, 34-38%, and 42-43% of water saturation. Reservoirs and percent of reserves tend to be largest in the lower and then the middle water saturation values.
Oil-column thickness
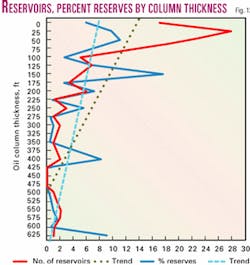
The number of reservoirs and the percent of reserves plotted by oil-column thickness intervals of 25 ft are shown by Fig. 13. Oil-column thickness in 133 reservoirs ranged from 10 to 625 ft with an average of 115 ft.
Maximum number of reservoirs in one oil-column thickness was 28 in the 25-50 ft interval with 10% of the reserves and an average thickness of 36 ft. Maximum percent of reserves was in five reservoirs in the 150-175 ft thick interval with 18% of the reserves and an average thickness of 153 ft.
Largest reserves of 751 million bbl were in the thickness interval of 150-175 ft. Largest average reserves were 663 million bbl in one reservoir in the 625-650 ft thickness interval.
Oil-column thickness in the reservoirs with over 100 million bbl reserves ranged from 48 ft to 625 ft and apparently had no effect on the amount of reserves present.
Below 300 ft in oil column thickness there was a good relationship between the number of reservoirs and the percent of reserves. Above 300 ft the relationship between the number of reservoirs and the percent of reserves was poor.
Above 225-250 ft in thickness only one interval had more than 2 reservoirs. However, two of the larger reservoirs were in this range. Sixty-five percent of the reservoirs and 34% of the reserves were concentrated in reservoirs where the oil columns were less than 100 ft thick. The reservoirs and percent of reserves were concentrated in the lower range of the oil-column thickness values.
Using the data
Review of the changes in the values of reservoir properties and the effect of such changes on the number of reservoirs and the percent of reserves should give clues for areas to be considered prospective and for areas to be avoided in exploration by indicating how these changes affect the number of reservoirs and the percent of reserves.
Subsurface mapping based on this type of review may indicate where the most reservoirs or largest percent of recoverable reserves can be found. This analysis should be considered only as an example and the results not strictly applied to other areas.
Bibliography
Galloway, W.E., Ewing, T.E., Garrett, C.M., Taylor, N., and Bebout, D.G., "Atlas of Major Texas Oil Reservoirs," Bureau of Economic Geology, Austin, Texas, 1983.
Haeberle, F.R., "Study of Reservoir Properties Can Yield Exploration Clues," OGJ, June 21, 1999, pp. 62-65.
Haeberle, F.R., "How Reservoir Property Variations May Effect Frio Hydrocarbon Volumes," OGJ, Oct. 15, 2001, pp. 30-38.
Halbouty, M.T., "Giant Oil Fields in United States," in "Geology of Giant Petroleum Fields," AAPG Memoir 14, November, 1970.
Landes, K.K., "Petroleum Geology of the United States," 1970, pp. 225-282.
The author
F.R. Haeberle ([email protected]) is a consulting geologist who moved to Delaware, Ohio, after 20 years in Dallas. He has worked for Standard Oil Co. of Texas, Atlantic Refining Co., Mobil Oil Corp., Mayfair Minerals, and J.J. Lynn Oil Division. He holds BS and MS degrees in geology from Yale University and an MBA degree in finance from Columbia University Graduate Business School.
