Study evaluates the impact of nitrogen on gas processing efficiency
Instituto Mexicano del Petróleo conducted a study to evaluate the effects of high nitrogen levels on gas processing operations. The results show that the diethanolamine (DEA) solvent does not absorb nitrogen and, for the same gas and solvent flow rates at different compositions, the sweetening process does not appear to be affected.
Because some of the natural gas streams from wells in the Cantarell reservoir, Gulf of Mexico, began to contain more nitrogen, we were interested in estimating its effect on gas processing operations, especially the sweetening and liquid recovery units. We therefore simulated the operations of these units at different levels of feed nitrogen.
To simulate the sweetening process, we used the TSWEET simulator from Bryan Research & Engineering Inc. A sour gas stream with a flow of 200 MMcfd was the reference stream. We used the simulator data bank and thermodynamic models.
We used the Pro/II v. 5.0 simulator, from Simsci-Esscor, and real data to simulate the NGL recovery plant.
We analyzed gas streams with nitrogen levels of 5, 10, 30, and 50 mole %.
The heat duty necessary to cool the natural gas stream can be supplied with existing equipment. Compression and expansion equipment show the greatest effects of the increased nitrogen. And at high nitrogen concentrations, separators can drag liquid into the gaseous phase.
Methodology
We simulated a gas-sweetening unit that uses DEA as a sweetening solvent.
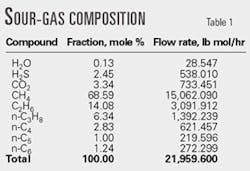
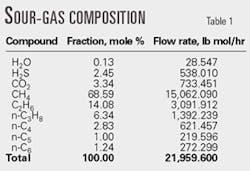
Table 1 shows the composition for a gas flow rate of 200 MMcfd that is treated with a 35 wt % DEA with a flow rate of 1,128 gpm.
By design, the DEA solution also contains some H2S and CO2 from the regeneration tower.
We assumed an absorption tower efficiency of 33%, which resulted in eight ideal stages.
For the regeneration tower, the efficiency was 50% resulting in 10 ideal stages. The simulation was version 98.3 of the TSWEET simulator.
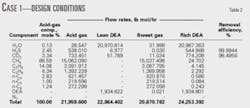
Table 2 shows the streams and design conditions for the absorption tower for the first simulation (Case 1). The sour gas molar flow rate is 21,959.6 lb mol/hr.
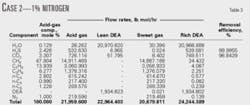
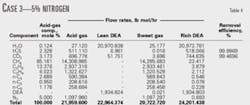
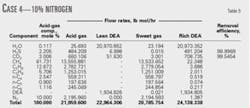
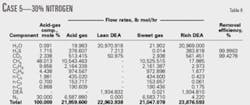
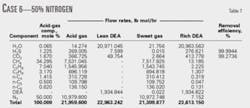
Cases 2-7 correspond to sour gas streams with increasing nitrogen levels at constant flow rates to maintain the design capacity of the absorption tower. Stream compositions change due to the presence of nitrogen.
Tables 2-7 show that, for the same flows of load and solvent but different compositions, sweetening is not affected. Also, the simulations show that the DEA does not absorb N2.
NGL recovery
We also analyzed the effect of increased nitrogen in the feed to the cryogenic plant. We maintained the same molar flow and all design simulation parameters.
The cryogenic NGL-recovery plant uses gas condensation at different temperatures to separate ethane and propane from the natural gas. The plant includes dehydration, cooling, fractionation, and recompression of residual gas.1
We used the Soave Redlich Kwong equation to calculate the thermodynamic properties (entropies, enthalpies, liquid vapor equilibrium, densities). For liquid density, we used the Lee-Kesler correlation.
To calculate transport properties, we used pure compound correlations.
For water saturation and decantation calculations, we used the Pro/II model. For the heat exchange calculations, we used a module with the Bell method for film coefficients.2 We used a design value of 0.002 hr-sq m-°C./kcal for the fouling coefficients. The processing capacity of the simulated plant is 600 MMcfd.
Dehydration
Because water in the feed stream to the demethanizer tower forms hydrates, dehydration is needed to obtain a specification of <1 ppm. In addition, an antifreeze agent like methanol must be added.
Packed molecular mesh beds perform the dehydration in which the water is selectively absorbed for 8-24 hr. A high-temperature gas stream regenerates the molecular mesh.
The simulator we used does not contain a dehydration module; it is limited to an indication of beginning and ending water concentration.
This is a limitation for the cases in which the volumetric flow varies substantially.
Cooling
Dehydrated sweet gas is cooled with propylene, which is contained in a refrigeration circuit.
The sweet gas then cools further in a Joule-Thomson expansion, which can occur in the gaseous phase or with liquids that have condensed during earlier cooling stages.
The expansions occur in turbines that drive compressors in the recompression step.
Natural gas is cooled to 35° C. with water in a precooling step before the dehydration. Once the gas is dehydrated, it divides into two streams that enter two cooling trains.
The first train has three heat exchangers.
In the first and third exchangers, residual gas provides cooling; propylene is the cooling medium in the second exchanger.
The second train uses low-pressure residual gas for cooling in the three heat exchangers.
The first train uses high-pressure residual gas from the demethanizer condensers. The cooled gas streams are then mixed.
The condensates are sent to Tray 18 in the demethanizer.
Fractionation
Fractionation occurs in a demethanizer tower, which produces a residual gas stream (methane) and a stream of ethane and condensable components.
The tower has 30 ballast trays with a 24-in. tray spacing. It has three distinct sections: Trays 1-6 with a 198-cm diameter, Trays 7-17 with a 259-cm diameter, and Trays 18-30 with a 396-cm diameter.
The demethanizer has two kettle-type reboilers.
We used the total tower efficiency as step efficiencies to simulate 20 theoretical trays.
This caused the feeds to Trays 1, 6, 8, and 18 to correspond with Stages 1, 3, 5, and 11 of the simulation.
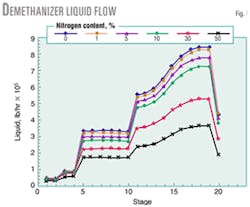
Fig. 1 shows the liquid flow as a function of stage for different nitrogen contents.
In the first stages, the flow varies little, whereas on the last stages the flow increases continuously.
According to a hydrodynamic analysis of the tower, there is a risk of flooding. In this case, however, the risk is not as great because ballast trays are used. The tower pressure is 28 kg/sq cm.
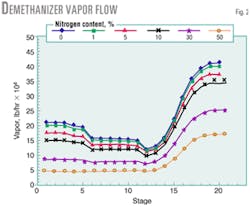
Fig. 2 shows that the vapor flow reaches its least variation near Stage 11. The vapor flow decreases due to incoming feeds on Stages 5 and 11. At higher nitrogen concentrations, vapor flow between Stages 1 and 12 does not vary much.
Gas recompression
Residual gas from the demethanizer is compressed and heated.
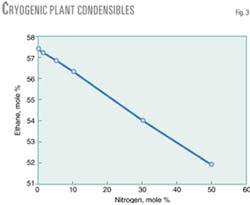
Fig. 3 shows ethane stream variations at the different nitrogen concentrations.
At a constant feed rate and increased nitrogen, the production of condensibles diminishes. The decrease is not directly proportional, however.
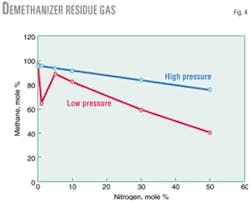
Fig. 4 shows the methane concentration in the high-pressure and low-pressure residual gas from the demethanizer.
The concentration of methane decreases significantly, but the effect is greater in the low-pressure stream. This stream feeds to a direct-fired furnace and, depending on the temperatures required in this furnace, it may be a better option to use the high-pressure residual gas as fuel.
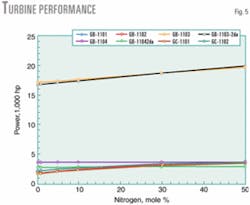
The increase in nitrogen has the largest effect on the compressor and turbines. In this simulation, we assumed an adiabatic efficiency of 70%. The compressors were tied to some of the turbines. This meant that the polytropic efficiency did not have significant variations. The same occurred with the difference in entrance and exit pressures.
Fig. 5 shows that the turbine work increased incrementally in all cases. Most of the work increase was due to a molecular-weight increase for the gaseous streams.
Also, the high-pressure residual gas stream suffered a significant decrease in volume, which caused the turbines to provide the power for the compressors GB-1101 and GB-1102. These compress residual gas frm the cooling section.
Mist separators
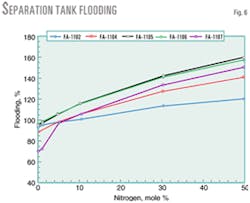
Fig. 6 shows the percentage of flooding in the mist separators. They have high-efficiency meshes.
Drag will occur in the liquid phase with more than 30% of nitrogen in the feed stream.
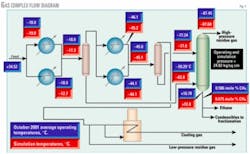
Fig. 7 shows the flow diagram in which the operating values are compared with the values obtained from the simulation. They show good agreement.
Liquid condensable removal
Overall, the simulation study showed that:
- Heat duty necessary to cool the natural gas stream is available with existing equipment.
- High nitrogen content has the largest effect on compression and expansion equipment. At high concentrations of N2, the compressors will be over capacity.
- High nitrogen concentrations create a flooding in the mist separators.
- The demethanizer will suffer a decrease in flows at higher nitrogen concentrations. Fortunately, it has ballast trays that give it flexibility.
- The direct-fired furnace could use the high-pressure residual gas stream, rather than the low-pressure residual gas, because the high-pressure stream has a higher concentration of nitrogen.
References
1. Subdirección de Ingeniería de Proyectos de Plantas Industriales, "Tecnología de Plantas Criogénicas IMP," Instituto Mexicano del Petróleo, Mexico City, 1984.
2. Reid, R.C., Prausnitz, J.M., and Poling, B.E., The properties of gases and liquids, Fourth Edition, New York: McGraw-Hill Co., 1987.
The authors
Alejandrina Salas Padrón is a project leader in the Programa Integral de Investigación en Gas at Instituto Mexicano del Petróleo (IMP), [city], Mexico. She has worked for IMP since 1993. Salas holds a Docteur-Ingénieur (1980) in chemical engineering from Institut National Polytechnique, Toulouse, France, and a Docteur in physicochemistry from Université Claude Bernard, Lyon, France.
J. Esteban Rodríguez Rodríguez is a process engineer at IMP, Mexico City, and project leader for the Programa de Crudo Maya. He joined IMP in 1978. He has taught process engineering at Instituto Politécnico Nacional, Mexico City, since 1976. He holds a BS and MS (1979) in chemical engineering from Instituto Politécnico Nacional.
Esteban Burgos Vázquez is a process engineer in the Crudo Maya Program at IMP, Mexico City. He joined IMP in 1979. He has also taught process engineering at Instituto Politécnico Nacional, Mexico City, since 1992. Burgos holds a BS and MS in chemical engineering from Instituto Politécnico Nacional.
Andoni J. Austrich Senosiain is a process engineer at IMP, Mexico City. He joined IMP in 1980. He has also taught process engineering at Instituto Politécnico Nacional, Mexico City, since 1991. Austrich holds a BS and MS in chemical engineering from Facultad de Química at Universidad Nacional Autónoma de México, Mexico City.
Ernesto Martínez Tapia is a process engineer at IMP, Mexico City. He has worked at IMP's Programa Integral de Investigación en Gas since 1987. Previously, he worked for Mobil Oil Co., Hoechst AG, and PPG Industries.
