FISCAL META-MODELING—2
This is the second of two parts on the application of a meta-modeling approach to fiscal system analysis. The material in the article is more fully discussed in Kaiser and Pulsipher, 2003.1 2
Na Kika development scenario
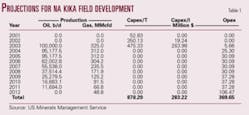
The development scenario for Na Kika is based on an estimated gross ultimate recovery of 300 million boe. Proved reserves are estimated at 189 million bbl of oil and 728 bcf of gas. The cash flow projection is shown in Table 1.
Total project cost is $1.26 billion, excluding leasing costs of $20 million.10 11 About 50% of the costs are associated with the fabrication and installation of the host facility and pipeline, 25% of the costs are associated with the fabrication and installation of the subsea components, and 25% are associated with the drilling and completion of the wells. The life cycle capital expenditure is estimated as $3.73/bbl with operating cost estimated at $1.20/bbl. Opex is forecast to increase from less than $1/bbl early in the production cycle to over $8/bbl near the end of the life of the field.
Regression model results
The design space for the four models under consideration is shown in Table 2.
In Model I the system parameters are selected uniformly from each design interval, while in Model II, the design intervals become more narrowly defined and the hydrocarbon prices assumed lognormally distributed.
Model III employs the same parameter intervals as in Model II but the oil and gas price is assumed to vary over each year of the production cycle; i.e., Pto ~ LN(25, 5), Ptg ~ LN(3.5, 1.5) for t = 1,U, 12, to more accurately reflect the volatility of the hydrocarbon prices.
In Model IV, the Model III parameters are applied with an annual tax rate selected from a triangular distribution; i.e., Tt ~ TR(0.38, 0.44, 0.50) for t = 1,U, 12.
The results of the regression models for τc(f, Q), PV(f, Q), and IRR(f, Q) are shown in Table 3. The model coefficients all have the expected signs, the fits are robust, and all the coefficients, except the government discount factor, are highly significant. For any value of (Po, Pg, R, Q, T, Dc, Dg) within the design space, the regression model can be used to evaluate and compare parameter selections.
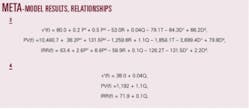
For Model I, the results of the meta-model are shown in (3) in the box on this page. The functionals indicate the general characteristics of the field development and the exact manner in which changes to the system variables impact the economic and system measures of the field.
As the prices of oil and gas increase, so does the take, present value, and internal rate of return of the field. Although the regression coefficient associated with the price of gas exceeds the value of the oil price coefficient, the oil price is a more significant factor since the range for the oil price Po ~ U(20, 30) is greater than Pg ~ U(2, 5). The price of oil contributes about twice the impact to each measure as the price of gas.
Royalty and taxes contribute negatively to the operators take, present value, and rate of return statistics. The absolute magnitude of the tax coefficient exceeds the royalty rate coefficient. This is not entirely unexpected since a royalty suspension has been granted on the first Q(f) MMboe production thereby dampening its overall impact.
The value of Q(f) is positive since Q(f) translates to volume of royalty relief, and as the volume of royalty relief increases, so does the value of the economic and system measures. The contractor and government discount factors are approximately equal in the take computation, but a significant difference exists in the present value and rate of return measures.
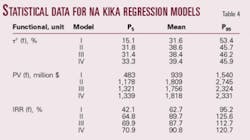
In Model II, the hydrocarbon prices are assumed lognormally distributed and the design intervals are more narrowly defined. The impact of these changes to the regression models is shown in Table 3. The mean, P5, and P95 estimates of the computed measures are shown in Table 4. These values bound the expected range of each measure for the design space and model specification. Observe that as the design specification becomes more narrowly defined the range defined by P95 – P5 generally shrinks.
The inclusion of structural variability within the meta-evaluation is examined in Model III and Model IV. The hydrocarbon prices and tax rates are assumed to vary annually, and although this negatively impacts the robustness of the model fits, the impact on the regression coefficients is relatively minor. The variability introduced through Pto and Ptg do not noticeably affect the range defined by P5 – P95.
The ratio d/g for each regression model provides an estimate of the correspondence between royalty relief volume suspensions and the royalty rate. For the present value functional for instance, a 1 MMboe change in royalty suspension is equivalent to 0.087% ≈ 0.1% change in the royalty rate. Or in other words, a 10 MMboe increase in the value of Q(f) is roughly equivalent to a 1% decrease in the royalty rate with respect to its impact on the present value of the field. Similar observations follow for the take and rate of return measure.
Impact of royalty relief
The design parameters of royalty relief include the royalty rate R, 0 ≤ R ≤ 1, and level of the suspension volume, Q(f). Intuitively, it is clear that decreasing the value of R and/or increasing Q(f) will act to improve field economics, and the manner of the impact can be determined through empirical modeling.
If Po = $25/bbl, Pg = $3.50/Mcf, R = 16.67%, T = 40%, Dc = 20%, and Dg = 10%, then based on the functionals constructed for Model I, we obtain the relations shown in (4) in the box on p. 43. For Q = 0 (no royalty relief), the take, present value, and rate of return of the investment are estimated at 38%, $1.192 billion, and 71.9%, while with Q = 87.5 MMboe (royalty relief), τc(f) = 41.5%, PV(f) = $1.288 billion, and IRR(f) = 80.7%. As Q(f) increases royalty is suspended on the initial Q(f) MMboe production and both the contractor take and economic measures of the field increase.
The value of royalty relief to the operator as a percentage of the present value is estimated as VPV (f, Q) = 0.092Q. For Q = 17.5 MMboe, VPV (f, Q) = 1.6%; for Q = 52.5 MMboe, VPV (f, Q)= 4.8%; and for Q = 87.5 MMboe, VPV (f, Q) = 8.1%.
In terms of the contractor take, the percentage variation of τc(f) as a function of Q relative to the baseline case of no relief is readily computed as Vτc(f, Q) = 0.00105Q. For Q = 17.5 MMboe, Vτc(f, Q) = 0.018%; for Q = 52.5 MMboe, Vτc(f, Q) = 0.055%; and for Q = 87.5 MMboe, Vτc(f, Q) = 0.092%.
Acknowledgment
The advice, patience, and critical comments of Radford Schantz, Stephanie Gambino, and Kristen Strellec of the Minerals Management Service (MMS) are gratefully acknowledged. Radford Schantz suggested the initial formulation of the problem considered in this article, and special thanks also goes to Thierno Sow of the MMS for generating the cash flow parameters for Na Kika. This article was prepared on behalf of the US Department of the Interior, Minerals Management Service, Gulf of Mexico OCS region, and has not been technically reviewed by the MMS. The opinions, findings, conclusions, or recommendations expressed in this paper are those of the authors and do not necessarily reflect the views of the MMS. Funding for this research was provided through the US Department of the Interior and the Coastal Marine Institute, Louisiana State University.
References
1. Kaiser, M.J., and Pulsipher, A.G., "Fiscal system analysis—concessionary systems," Center for Energy Studies, Louisiana State University, Baton Rouge, June 2003.
2. Kaiser, M.J., and Pulsipher, A.G., "Fiscal system analysis—contractual systems," Center for Energy Studies, Louisiana State University, Baton Rouge, August 2003.
3. Johnston, D., "Global petroleum fiscal systems compared by contractor take," OGJ, Vol. 92, No. 50, 1994, pp. 47-50.
4. Van Meurs, A.P., and Seck, A., "Governments cut takes to compete as world acreage demand falls," OGJ, Apr. 24, 1995, pp. 78-82.
5. Barrows, G.H., "Worldwide concession contracts and petroleum legislation," PennWell Books, Tulsa, Okla., 1983.
6. Barrows, G.H., "World fiscal systems for oil," Van Meurs & Associates Ltd., Calgary, 1994.
7. Johnston, D., "International petroleum fiscal systems and production sharing contracts," PennWell Books, Tulsa, Okla., 1994.
8. Gallun, R.A., Wright, C.J., Nichols, L.M., and Stevenson, J.W., "Fundamentals of oil & gas accounting," Fourth Edition, PennWell Books, Tulsa, Okla., 2001.
9. Baud, R.D., et al., "Deepwater Gulf of Mexico 2002: America's expanding frontier," OCS Report MMS 2002-021, US Department of the Interior, Minerals Management Service, Gulf of Mexico Region, Office of Resource Evaluation, New Orleans, April 2002.
10. DeLuca, M., "Deep developments taking shape," Offshore Engineer, April 2003, pp. 48-62.
11. See website (www.countonshell.com).


