New charts provide accurate estimations for water content of sour natural gas
An update of charts that gives estimations of the water content of sour natural gas, published 10 years ago, reflects new experimental data and are more accurate for low pressures.
Sour gas producers are interested in the water vapor content of sour natural gas at saturation. Knowledge of the water content is important when one designs sour-gas dehydration facilities, prevents hydrate formation with chemical inhibitors in sour-gas gathering systems, and estimates water production with sour gas in plant inlet separators.
Updated charts
A chart-based method published 10 years ago (OGJ, Mar. 29, 1993, p. 61) gave estimates of the equilibrium water vapor content of sour natural gas for a range of conditions including: % H2S equivalent content up to 55 mole %, pressures up to 70 MPa, and temperatures of 10-175° C.
We developed those charts using the limited published experimental data on the water content of sour natural gas that were available. More recent experimental data show that the original charts give low estimates of water content for sour gas mixtures, especially at low pressures.1
We consequently decided to revise the original charts.
The basic method from the original article has undergone some minor changes. The main effect of the revision is a slightly higher estimate of water content of sour natural gas as compared to the original charts.
These steps estimate the water content of sour gas:
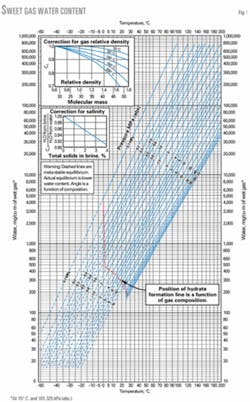
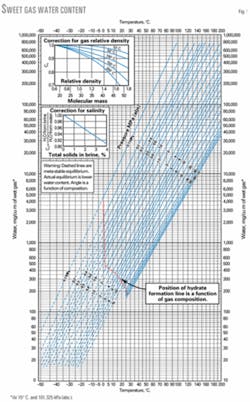
1. At the pressure and temperature of interest, determine the water vapor content of sweet gas from Fig. 1.
2. Determine the mole % H2S equivalent concentration of the sour gas from: mole % H2S equivalent = mole % H2S + 0.7 X mole % CO2.
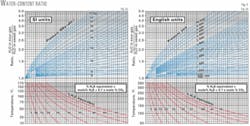
3. From Fig. 2a at the bottom left hand temperature scale, move to the right to the mole % H2S equivalent concentration. Interpolate between the lines if necessary.
4. From this point, move to the upper chart, to the pressure of interest.
5. From the pressure point, move to the left, to the ratio scale. Read the value on the scale.
6. Multiply the value from Step 5 by the water content determined for sweet gas in Step 1. The result is the estimate of the saturated water content of the sour gas at the pressure and temperature of interest.
Fig. 2b shows the revised sour water ratio chart in English units. The chart is valid for the same concentrations, pressures, and temperatures as the SI units chart.
We compared the results from the revised charts to those generated with AQUAlibrium, a commercial software program,2 for a range of sour gas mixtures at various pressures and temperatures.
The generated data include: H2S contents of 3-38 mole % with CO2 contents of 3-43 mole %, pressures of 2-70 MPa, and temperatures of 10-175° C.
We generated 29 tables with approximately 1,400 data points. A complete tabulation of the conditions investigated and the comparison results is available from the authors.
The overall average error was less than 1%. A few points showed a discrepancy of more than ±10%.
Sample problem
This problem uses data from the original article but is solved using the revised charts. It illustrates the method for estimating the equilibrium water vapor content of a sour gas mixture in SI units.
Problem: estimate the equilibrium water vapor content of a sour gas containing 30 mole % CH4, 10 mole % H2S, and 60 mole % CO2 at 107° C. and 8.36 MPa.
Solution:
1.Determine the equilibrium water-vapor content of sweet gas at the temperature and pressure conditions using Fig. 1. It is approximately 14.2 g/cu m.
2.Calculate the mole % H2S equivalent of the mixture by adding the mole % H2S to 70% of the mole % CO2. 10 mole % H2S + (0.7. X 60 mole % CO2) = 52 mole % H2S equivalent.
3.Enter the SI water content ratio chart (Fig. 2a) at 107° C. and move to the right to 52 mole % H2S equivalent. From this point, move vertically to the absolute pressure of 8.36 MPa. Move to the left side of the chart and obtain the corresponding water vapor content ratio. It is approximately 1.25.
4.To obtain the equilibrium water vapor content of the sour gas mixture, multiply the water vapor content of the sweet gas from Step 1, by the ratio from Step 3: 14.2 g/cu m. X 1.25 = 17.75 g/cu m.
The experimental water vapor content for this example is 17.14 g/cu m. The value from the computer program is 18.03 g/cu m.
References
1."Water Content of Natural Gas Systems Containing Acid Gas," Research Report RR-174, Gas Processors Association, Tulsa, Okla., January 2001.
2.Carroll, J. J., "The Water Content of Acid Gas and Sour Gas from 100° to 220° F. and Pressures to 10,000 psia," presented to the 81st Annual GPA Convention, Mar. 11-13, 2002, Dallas.
The authors
Gordon Wichert is the manager of new ventures for Penn West Petroleum Ltd., Calgary. He has 10 years' experience in oil and gas operations. He holds a BSc and an MSc in chemical and petroleum engineering from the University of Calgary. He is a member of the Canadian Institute of Mining, Metallurgy and Petroleum; SPE; and the Association of Professional Engineers, Geologists and Geophysicists of Alberta.
Edward Wichert (ewichert@ sogapro.com) is an independent consultant and an adjunct professor in the department of chemical and petroleum engineering at the University of Calgary. His research interests are mainly related to sour gas. He has experience in oil and gas operations, drilling, oil and gas production and processing, reservoir engineering, and economic analysis. He holds a BSc in petroleum engineering from the University of Alberta and an MS in chemical engineering from the University of Calgary.


