Floating proppant stimulates sand with a high permeability contrast
Fracturing treatments performed in three wells in Minas oil field, on Sumatra Island, successfully placed a floating graded walnut-hull proppant in the top section of a layered sandstone reservoir.
PT Caltex Pacific Indonesia has operated the extensively waterflooded field since 1952.
Most sands in the field have a fining upward sequence. The upper part has lower permeability in which newer well logging techniques indicate higher remaining oil saturation, while water has generally swept the lower part that has very high permeability.
The idea of a floating proppant involves creating an hydraulic fracture with a fracturing fluid that contains proppant with a lower specific gravity than the fluid. After the treatment is pumped, the proppant floats to the top of the created fracture, allowing the bottom portion of the fracture to close.
This concept would stimulate the upper, oil-bearing portion of the reservoir while avoiding stimulating the lower portion that had already watered out.
Fracturing
The petroleum industry extensively uses hydraulic fracturing to break down or fracture a reservoir and then place a propping agent into the fracture to maintain a conductive path for fluid to flow to the wellbore.1 2
In the Minas field, the intent of fracturing was to establish a highly conductive fracture in the upper part of the reservoir while minimizing the conductivity in the lower part. The upper part has a 20-300 md permeability, while the lower part, with 1,000-4,000 md, produces at high water cuts.
One objective in fracturing is to keep the fracture growth in the zone of interest. This optimizes economics by placing proppant in the main zone of interest and avoids placing proppant in water zones.
If the fracture grows into the lower water-bearing zone, the goal would be to avoid propping this portion of the fracture open so that little if any conductivity remains after the fracture closes. This would minimize production from the lower portion of the reservoir when the well is placed on production.
Reservoir description
The Minas field contains more than 1,400 wells and has been pattern waterflooded since 1986. Water has swept and watered out most formation layers, especially the high-permeability zones.
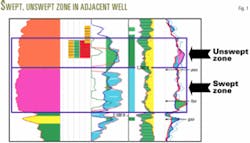
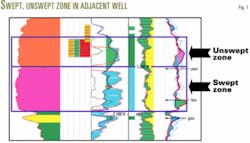
The narrow upper part of the sand in the unswept area generally has good productivity with a low oil cut (Figs. 1 and 2). Thus, the focus now is on recovering oil from these low to moderate-permeability zones. Recovering this oil is a challenge because the oil overlies the high-permeable zone that now produces in excess of 90% water.
The assumption is that any fracturing treatments will extend down into the lower, more permeable, water-producing zone, resulting in preferential water production without the use of specialized techniques.
Proppant, fluid selection
After reviewing logistics and economics, the team decided to select walnut hulls with a mesh size of 10/40 for the floating proppant. Spherelite was considered but rejected because of economics, availability, and low crush resistance. Other proppant materials may be considered in the future.
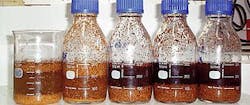
Laboratory tests determined the fluid density required for the proppant to float (Fig. 3). Several brine densities were checked for their ability to float the walnut-hull proppant. Most of the proppant settled to the bottom when placed in 1.20 sp gr calcium chloride brine, and about half sank in 1.29 sp gr brine.
When placed in 1.35 sp gr CaCl brine, virtually all of the walnut hulls floated on the top of the brine. Conductivity tests determined the long-term conductivity of a walnut-hull pack. For the base fluid, the team selected a CaCl brine because it has sufficient density to float the proppant and was readily available and relatively inexpensive.
Some benefits of this fluid are:
- Crosslinked or highly viscosified fluid provides a means to control fluid loss through filter cake development.
- Heavy brine helps to control fluid loss by having higher filtrate viscosity that provides additional viscosity fluid-loss control.
- Crosslinked or highly viscosified gel enables viscous fingering.
Pad fluid selection
A pad fluid pumped at the beginning of the fracturing treatment creates the required fracture geometry. Selection of the pad fluid depends on rock properties, such as permeability, fluid sensitivity, and bottomhole temperature.
The team selected a gelled CaCl brine for the pad fluid, with the gelling agent being hydroxy-ethyl cellulose (HEC). The brine had to be a nearly saturated, crosslinked CaCl brine.
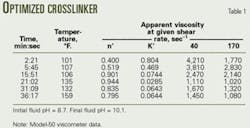
The first choice was to pump weighted pad fluid using Xanthan gel that contained a fine-meshed calcium carbonate and starch to increase density and control fluid loss (essentially a modified drill-in fluid). But because of this system's complexity and the potential to cause excessive damage, the team selected the HEC gel after ensuring that it could be crosslinked with a high CaCl content and fluids with up to 1.38 sp gr. Also, the team tested several crosslinkers and selected a zirconium oxychloride solution for the crosslinker additive to prepare most of the crosslinked fluids. This crosslinker achieved the required fluid properties (Table 1).
Several tests noted the effect of various fluid additives on the crosslink. These tests indicated that starch used as a fluid-loss additive significantly delayed the onset of the crosslink. When a crosslink did form, it was much weaker compared to a crosslinked sample that did not contain starch.
This same testing indicated that kerosine added at 5% by volume and silica flour at 15 lb/1,000 gal did not affect the crosslink. Therefore, the team selected these two chemicals at these concentrations as the fluid-loss additives. The proppant-carrying fluid would not be crossslinked to achieve effective fingering or floating of the proppant on top of the pad. Thus, the treatment used a 20-lb linear HEC gel with no CaCl added.
Breaker design
The fracturing fluid must be removed from the fracture without removing the proppant and without damaging the conductivity of the proppant pack. The optimal removal of the fluid requires thinning the viscous fluid, transporting the proppant, to a near-water state after the treatment is completed.
Chemical breakers for reducing viscosity of guar, derivatized guar, and HEC polymers are generally grouped into three classes: oxidizers, enzymes, and acids. Tests to find the optimum breaker concentration indicated that the combination of a strong oxidizer with a catalyst provided the best performance. Furthermore, the breakers did not appear to affect the crosslink rate of the fluid adversely.
Frac simulator selection
Most conventional fracture simulators have a limited application for analyzing the proposed fracturing treatment. These pseudo-3D models usually average the mechanical properties over the pay interval and assume uniform fracture growth and fluid velocities in the fracture. Critical to the proposed fracturing treatment was the modeling of the density control and viscous fingering characteristics.
To do this modeling, the team found that a grid-based, finite-element fracture simulator was an ideal tool for this complex lithology, including mechanical rock properties and reservoir porosity. The simulator allowed reservoir permeability and mechanical properties to be accurately set up in the grid.
A modified power-law rheology model allows the finite-element model to account for apparent viscosity at any point in the created fracture based upon the flow conditions at that point. This creates a means to model the expected viscous fingering.
The finite-element model does not assume a fracture geometry. The fracture initiates as the reservoir properties entered in the grid dictate, allowing the modeling of very complex fracture geometries. The finite-element technique also effectively models density variations. It tracks the fluids throughout the treatment to evaluate the success or failure of the design.
The very high permeability in the lower, wet portion of the reservoir provided a serious modeling challenge. It was not possible to limit the fracture height growth so that the fracture would not grow into this high-permeability portion. Once the fracture entered this portion, the high permeability caused excessive fluid loss that then created a pressure sink in the lower portion of the interval.
The pressure-sink effect dominated the fluid flow in the fracture and tended to pull the proppant-laden fluids toward this portion of the reservoir. This was undesirable because the job's goal was to avoid proppant placement in this zone.
Fluid-loss control alone was not enough to keep the proppant out of this zone. Proppant placement required also reducing the injection rate. This reduced rate allowed proppant placement into the fracture as the fracture closed, effectively eliminating the pressure sink effect and making it possible to isolate the proppant in the upper zone.
The presence of a small shale-carbonate break between the upper and lower zones was important in allowing the proppant to stay in the upper zone. This essentially allowed the top portion of the fracture to remain open while the lower portion closed.
Selected wells
The team selected three candidate wells for the fracturing treatment that were in the waterflood since 1993.
In Well No. 1, the first trial candidate, a saturation log indicated an unswept zone in the upper section (Fig. 1). Moreover, production data also indicated that this zone still had oil producing potential. The better oil production compared to surrounding wells and the relatively low water cut also supported this conclusion.
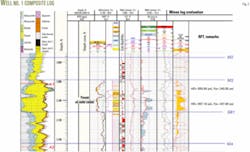
A composite log showed that the well had a shale streak that divided the upper low-permeability sand from the lower high-permeability sand (Fig. 2). The evaluation used petrophysics log data from Well No. 2 as a reference and combined it with the mechanical rock properties log of Well No. 1.
These data were then imported into the frac simulator for calculating the respective stresses, and fracture half length and height.
Preliminary design
Several simulation runs provided the optimum pumping schedule and thus the most effective proppant placement with different densities and fluid viscosities. The initial pumping schedule was as follows:
- Breakdown test with 2,100 gal of 20 lb/1,000 gal linear HEC gel without fluid-loss additive to investigate the earliest closure pressure and fluid efficiency.
- Step rate test at 0.5, 1, 1.5, 2, 4, 6, 10, to 12 bbl/min, using 20 lb/1,000 gal linear HEC gel to investigate the stress boundary and fracture propagation pressure
- Minifrac test, using 40 lb/1,000 gal crosslinked gel fluid, to investigate the fluid efficiency of the fluid used for the pad stage
Minifrac
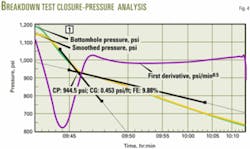
In the minifrac, the breakdown test indicated a 0.55 psi/ft fracture gradient and a 0.45 psi/ft closure pressure. The step rate test followed immediately after the fracture closed and was analyzed for breakdown and fracture extension pressure (Fig. 4). A surface read-out provided the bottomhole pressures for matching the predicted pressures.
The pressure decline showed similar leak-off characteristics compared to the breakdown test.
The minifrac included 40 lb/ 1,000 gal linear HEC with fluid-loss additives followed by 40 lb/1,000 gal crosslinked gel, pumped at 12 bbl/min.
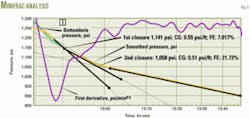
As expected, the pressure decline had multiple inflection points because of the presence of different layers. These points suggest significant variations in stress over the height of the created fracture.
These different closure pressures can indicate the different stresses for the low and high-permeability layers.
The G-function and the square-root-of-time plot (Fig. 5) show multiple inflections with one of the key events occurring early during the decline curve. This event indicated the closure of the higher leak-off portions of the zone. An earlier closure exists, suggesting that the fracture probably did grow into part of the shale section, but the stress caused the fluid to move quickly to the higher leak-off rock until it closed.
These multiple inflection points allowed for the modification of the stress profiles in the simulator to determine if the stress difference observed in the pressure decline matched reasonably well.
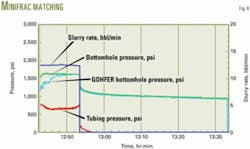
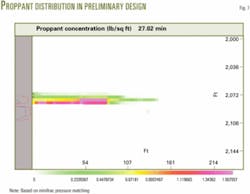
The good resulting match indicated that a significant amount of the created fracture volume was in the upper, lower-permeability sands (Figs. 6 and 7). The early events on the decline curve correspond well with the lower portion closing first.
After the stress profile was aligned, the analysis required increasing significantly the permeability of both zones so that the model matched the leak-off.
Other changes made to the model included the wall-building coefficient and spurt loss of the frac fluid.
The minifrac bottomhole pressure match indicated flow restriction through the perforations that was attributed to the high-viscosity crosslinked HEC gel increasing the friction pressure in the perforations.
Job design
The modeling indicated that the original treatment design would screen-out prematurely because of the high fluid loss. To overcome this, the modeling looked at changing variables such as pad volume, viscosity, or slurry rate.
Larger pad volumes did not show the desired effect, achieving only small gains. It was not desired to change viscosity, but increasing slurry rate to 18 bbl/min from 12 bbl/min showed favorable results.
Furthermore, the high leak-off in the lower interval combined with the density variation in the fluids can improve the tendency of the proppant to stay in the top of the interval.
Fig. 7 shows that the treatment achieves about 160 ft of effective fracture half length. It is important to note that the proppant pack effectively remains in the top of the fracture, while the fracture does tend to grow over the entire reservoir section.
This result from the finite-element model demonstrated that the treatment would reach its goals.
With the higher rate, permeability, and stress data, the simulator showed no increase in fracture width near the end of the treatment. This lack of increase suggested that the job would not be a tip screenout. The permeability variations seemed favorable for keeping the proppant where it was required.
In fact, the simulations showed that the proppant had an even greater tendency to stay on top and actually break out of the zone and enter the upper shale. This indicated that the design was more failsafe, and the proppant would not enter the lower sands even in the high-permeability case.
The screenout in the final treatment occurred when the 2.5-ppg proppant stage hit the perforations. This suggests that the fracture width was still inadequate. Nevertheless, the job was pumped and completed as planned.
Production results
In general, for the three wells completed successfully with this technique, the rate and productivity index (PI) increased 1.5 times compared to initial production rates. Well No. 3, however, showed a decline in production rate.
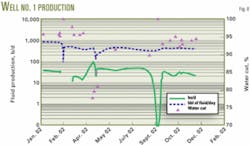
Two months after the initial treatment, the oil production slowly showed a better trend for Well No. 1 (Fig. 8).
Well No. 2 also responded well to the treatment. Before reaching this phase of stabilized production, these wells experienced pump failures several times due to proppant flowback problems.
Hanging up the modified screen liner under the intake pump proved effective in reducing the flowback problem.
The first well produced 31 bo/d with a watercut of 95% before the fracture treatment and 2 months after the fracture treatment produced 86 bo/d with a watercut of 80%.
Acknowledgments
The authors thank the management of PT Caltex Pacific Indonesia and Halliburton Co. for granting permission to publish this article. Special thanks to Manny Gonzalez, Joe Schmidt, Richard Pauls, Reinhard Pongratz, and Scott Ashby for their help.
References
1. Martinez, S.J., et al., Formation Fracturing. Petroleum Engineering Handbook, H.B. Bradley Editor, SPE, 1987.
2. Economides, M.J., et al., Petroleum Well Construction. John Wiley & Sons, 1998.
3. Best Practices, Effective Sandstone Acidizing, No. F-3374R, Halliburton Energy Services Inc.
4. Hidayat, W., and Sumarna, D.E., "Optimization Strategy in Minas Waterflood Field," Paper No. SPE 38092, SPE Asia Pacific Oil and Gas Conference, Kuala Lumpur, Malaysia, Apr. 14-16, 1997.
5. Deeg, W.F.J., "The Effect of Frac-Fluid Density on Hydraulic Fracture Growth Direction and Width," Paper No. SPE 39427, SPE International Symposium on Formation Damage Control, Lafayette, La., Feb. 18-19, 1998.
6. Wright, C.A., et al., "Understanding Hydraulic Fracture Growth–Tricky but Not Hopeless," Paper No. SPE 56724, SPE Annual Technical Conference and Exhibition, Houston, Oct. 3-6, 1999
The authors Antonius Dwi Arinto is a reservoir engineer for the Minas operating unit, PT Caltex Pacific Indonesia, Sumatra, Indonesia. He has worked 5 years for PT CPI. Arinto has a BS in engineering from the University of Pembangunan Nasional, Yogyakarta.
Sukinto Anggono is a senior reservoir engineer for the Minas operating unit. He has worked 12 years with PT CPI. Anggono has a BS in engineering from Institute Technology Bandung.
Hasyim M. Nur is team manager for the Minas operating unit. He has worked 10 years for PT CPI. Nur has a BS in petroleum engineering from Trisakti University, Jakarta, and an MS in finance management from the University of Padjajaran, Bandung. He is a member of SPE and the Indonesian Petroleum Association.
Mezlul Arfie works for Terralog Technology Indonesia. He previous was a cementing engineer and production enhancement/stimulation technical professional for Halliburton Co. Arfie has a BS in mechanical engineering from Trisakti University, Jakarta.
Ron Dusterhoft is technology leader for Halliburton Energy Services. His work has primarily focused on hydraulic fracturing. Dusterhoft has a BS in mechanical engineering from the University of Alberta.
Torsten Kritzler is a senior technical professional for Halliburton Co. in Indonesia. He holds an MBA, an MS in mechanical engineering, an MRes. in advanced mechanical engineering, and is a Chartered Engineer of IMEchE. He also is an SPE member.
Based on a presentation to the SPE Asia Pacific Oil and Gas Conference, Jakarta, Apr. 15-17, 2003.
