A simple, practical approach provides a technique for calibrating tortuosity factors.
The methodology uses actual survey data and known surface hook loads for different operating conditions, such as tripping in, tripping out, and rotating off bottom, to arrive at appropriate friction factor values that can be further used in torque and drag calculations.
Once one determines the friction factors for both cased hole and open hole, sensitivity analyses can be performed on the planned survey. One can then arrive at the appropriate tortuosity values by comparing predicted results with the field driller's data.
Determining the tortuosity factors to apply in a well model is a challenge often encountered during well planning. No quantification method has been available.
A critical factor
Tortuosity is one of the critical factors in designing complex directional well trajectories, accurate build rates, precise steering in thin reservoirs, and extended reach wells. Currently, the industry uses different generations of rotary steerable systems and adjustable downhole tools to reduce wellbore tortuosity.
When planning a well, wellpath modeling commonly generates smooth curves, whereas an actual well contains doglegs and other irregularities. The difference between the planned smooth well profile and the actual well drilled can have a major impact on the torque and drag losses for the well.
Models apply different "rippling" or "roughness" techniques to a planned wellpath to simulate the variations found in actual wellpath surveys. This option renders planned (smooth) well profiles in a form that more realistically predict loads. Note that tortuosity is usually applied only when the surveys represent an unrealistically smooth path.
The industry has no standard for quantifying tortuosity, although it is usually expressed in degrees/100 ft, similar to the expression of dogleg severity. The calculation of "running tortuosity" is the station-to-station summation of the total curvature normalized to a standard course length.
In general, tortuosity is defined as the ratio of the actual path length to the straight-line length. Wellbore tortuosity includes any deviation from the planned trajectory, or the ratio of the summation of the total curvature, including the build and walk, to the survey stations' length.
The model applies rippling or undulation based on the sine wave method that modifies the inclination and azimuth of the survey point based on the concept of a sine-wave shaped ripple running along the wellbore. Magnitude (amplitude) and period (wave length) need to be input to the model.
Friction factor calibration
The following simple procedure is a guideline to estimating the tortuosity factors for a particular hole size:
- Calibrate the friction factor for casing with the actual survey data and record hook loads.
- Calibrate the friction factors for open hole and cased hole based on actual survey data and record drilling loads.
- Determine the appropriate tortuosity factor using the calibrated friction factors, actual survey data, and the original planned wellpath.
With the availability of definitive survey data, one can assume that the tortuosity of the well has been built into the survey. It can be used to calibrate the friction factor for the first hole size for which the tortuosity factor needs to be estimated.
Our example provides an analysis of two hole sections with 121/4 and 81/2-in. diameters. Daily drilling reports provided the actual measured weights for tripping in, tripping out, and rotating off bottom. Torque and drag calculations were used to predict the measured weights and torque while tripping in, tripping out, rotating off bottom, and rotating on bottom.
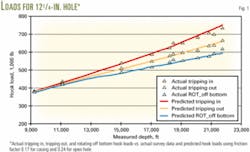
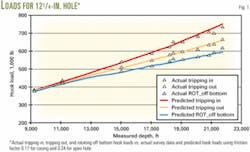
Comparing the field surface data with the predicted surface data using different friction-factor values revealed that a friction factor of 0.17 inside the casing resulted in the best match (Fig. 1).
Using the estimated casing friction factor, the model calibrated the openhole friction factor to match the entire 121/4-in. hole section. It was found that a casing friction of 0.17 and openhole friction of 0.24 match well with the predicted calculations (Fig. 1).
The predicted values are slightly conservative, especially for the tripping out operation. The 81/2-in. hole section was then used to validate the friction-factor values.
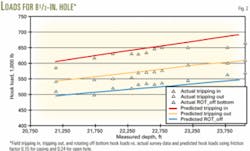
A similar procedure was followed for determining the casing friction factor for the 81/2-in. casing section, found to be 0.15. This is slightly lower than the casing friction factor of 0.17 for the 121/4-in. hole section. The difference may be attributed to the fact that when casing is run inside of another casing string, it smoothes out the effect of tortuosity and results in lower friction factor (Fig. 2).
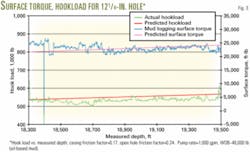
Data were available for the 121/4-in. hole section, with good surface torque, while rotating off bottom, and were compared with the simulated surface torque prediction (Fig. 3). The field data trend matched the predicted results well.
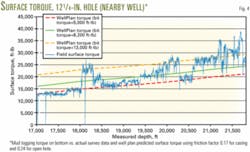
To further validate the results, simulations were rerun for a nearby well in the same field using similar friction factors used in the first well to predict surface torque while rotating on bottom. Mud logging data for torque, rotating on bottom, were available and used for this study.
Fig. 4 shows that the trend line has three different slopes: one between 17,000 and 18,000 ft, the next between 18,000 and 20,000 ft, and the third showing an increase toward TD. This can be explained by the fact that the weight on bit (WOB) and torque at bit were varying throughout the hole.
Three different torque-at-bit values were taken, 5,000 lb-ft, 8,200 lb-ft, and 13,000 lb-ft to mimic the down-hole conditions. The data in Fig. 4 indicate that the predicted upper (13,000 lb-ft), middle (8,200 lb-ft), and lower (5,000 lb-ft) trend lines bound the field data. The slopes of the lines are also in agreement.
Tortuosity factor calibration
After the friction factor values, the next step compares the planned surveys with actual surveys to determine a base line tortuosity value, i.e., wavelength and magnitude for the sine wave. Torque and drag calculations predict the hook loads for tripping in, tripping out, and rotating off bottom using the 121/4-in. hole section and planned survey for the well being analyzed.
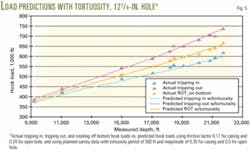
Use of the tortuosity wavelength (period) of 500 ft, with a 0.35 magnitude inside casing, and a 0.5 magnitude inside the open hole, yields a very good match between field surface data and predicted data (Fig. 5).
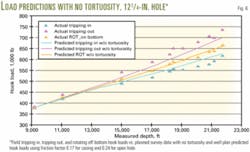
In comparison, Fig. 6 shows that when no tortuosity is applied, the simulated data are under-predicting, as compared to the field data. Viewing both plots shows that the predicted data are in close agreement with the field data in a tortuosity period of 500 ft, magnitude of 0.35 inside casing, and a magnitude of 0.5 inside the open hole.
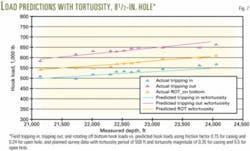
For the 81/2-in. hole section, Fig. 7 compares the predicted hook loads vs. actual hook loads. The results show that the simulated hook loads match closely with the field data when tortuosity is applied and under predicted when tortuosity is not applied, similar to the observations for the 121/4-in. hole section.
These results are specific to the deepwater wells in the Gulf of Mexico undertaken in this study. The friction factors vary based on hole diameter, hole conditions, lithology, and drilling- fluid type.
It can be concluded for these wells that good predictions were achieved by use of friction factors of 0.17 for casing and 0.24 for open hole in 121/4-in. hole. For 81/2-in. hole, the 0.15 friction factor value for casing is slightly lower, which we attribute to the smoothing effect of the casing being set inside another casing string.
For planned wellpaths applying the sine-wave tortuosity model, using a tortuosity period of 500 ft and magnitudes of 0.35 for casing and 0.5 for open hole, we achieved comparable predicted surface torque and drag results for different operating modes.
The authors Yuejin Luo ([email protected]) works on the tubular design team for BP's exploration and production technology group in Houston. Previously, he held various drilling operation posts in the Gulf of Mexico and North Sea and technology posts in Sunbury, UK, in well control, hole cleaning, and hydraulics. Before joining BP, he worked in China and the UK in drilling operations and technology. Luo holds a BSc (1981) from the University of China and a PhD (1988) from Heriot-Watt University, UK, both in petroleum engineering.
Kaiwan Barucha (KBarucha@ lgc.com) is an engineering consultant with Landmark Graphics Corp. and is working as an on site consultant for BP's drilling and well servicing group in Houston. Barucha holds a BS in mechanical engineering from the University of Oklahoma and is currently pursuing an MS in petroleum engineering from the University of Houston.
Robello Samuel (RSamuel@ lgc.com) is a technical advisor in Landmark Graphics' research and development division, Houston. He has more than 17 years of experience in domestic and international oil and gas drilling and completion operations, management, consulting, and teaching. He started his career as a field engineer in 1983. He is an active SPE member. Samuel holds a BS and MS in mechanical engineering from Anna University, Chennai (Madras), India, as well as an MS and a PhD in petroleum engineering from Tulsa University.
Faris Bajwa (FBajwa@ lgc.com) is a product geoscientist with Landmark Graphics R&D division, Houston. He holds a BS in petroleum engineering from the University of Tulsa and an MS in environmental science from the University of Houston.
