Gas well development through decision trees
Data mining massive geological databases is a leading edge statistical technique useful in oil and gas exploration.
Billions of dollars of potential profit can be generated from gas well data analysis on information stored in databases typically produced by oil and gas companies, governments, and others. The following discussion will outline data mining techniques, algorithms, methodologies, and research useful in exploration for gas and oil.
Several data mining and statistical techniques are available to exploration geologists such as: visual data mining tools, cluster analysis, neural networks, decision trees, and multiple regression.
Applying these algorithms to geological information can reveal potential profits in certain formations and areas. Successful application of data mining techniques can enable oil and gas companies to gain knowledge of future well locations with high probabilities of producing oil and gas. These new targets will typically "cluster" in geological formations that have shown a statistical predisposition or likelihood of being high cumulative gas producers. These same algorithms could also reveal high cumulative production of oil from geological data.
As a process, data mining follows a two-step plan of visual data mining to identify patterns of visual interest, followed by a second stage of applying algorithms such as decision trees that are applicable to finding potential exploration targets.
The data mining decision tree algorithm selected for this research resulted from testing several dozen different data mining techniques, methodologies, and software over a 4-year period. The data set chosen for this study contains oil and gas data from British Columbia, Canada.
Part two of this article will discuss SQL database language and preparing data for data mining algorithm input, primary functions of a decision tree, application of decision tree algorithms to geological data, and how data mining decision trees can work as both an exploration tool and a tool to ascertain the economics of potential oil and gas wells.
Data mining two-step
The data mining methodology used in Data Forest Mining Inc.'s research consisted of two complementary steps.
Visual data mining is the first step that allows us to examine massive amounts of data visually. This visual approach assists in the determination of what data mining technique is applicable to the data. Experienced data miners can see certain patterns in data indicative of which type of predictive algorithm will likely work best.
The next step, after visually mining data, is to apply a reduced set of data mining algorithms. The application of these sets of data mining algorithms is iterative until one algorithm is found which best predicts the information sought in geological databases.
Visual data mining
A picture is worth a thousand words, or, in this case, $4.7 billion (US).
For example, numbers, colors, types, units, and all other pieces of information, may be considered data. Extracting valuable information from data can be a challenge, especially when dealing with kilobytes, megabytes, or terabytes of information. This is a daunting task, as the human brain is limited in its ability to look at row upon row of data and see meaningful patterns.
Experience has shown that many of these patterns are not discernable with ordinary graphing packages such as Excel. One has to turn to visual data mining techniques to discern certain patterns in massive amounts of data.
Visual data mining techniques have found useful application in a variety of fields. For example, the banking industry applies such techniques to visualize large amounts of customer data (sometimes up to terabytes in size) for potential profit and return on investment via customer harvesting.
Customer harvesting is the process whereby an organization profiles a customer using purchase data and determines total disposable income. This total amount is then compared with the true amount the customer spends on the organization's products or services. The goal is to identify ways to capture the maximum amount of the customer's total disposable income, sometimes called "share of wallet."
Data miners are people who can sift through these large masses of data in order to find profitable or meaningful patterns. Data miners and geologists share many of the same visualization techniques and skill sets. Merge these two visually oriented disciplines, and one will find powerful synergies in visual analytical techniques applicable not only in the search for oil and gas well targets but also in other fields.
Data mining visualization software is not cheap, but alternatives exist which provide oil and gas geologists and data miners with free visualization tools. Data miners discover new and interesting patterns not found on the ordinary XY plane by plotting a higher number of data dimensions.
The use of different geometric shapes assigned to data points, coloration of data points, and size of data points are constructive tricks in the perception of extra dimensions in data. The fundamental principle here is to increase dimensionality if one does not spot a relationship at a lower dimension. For example, if one cannot find a relationship in two dimensions, then one could proceed to plot three or more dimensions to ascertain if any identifiable relationships exist. Practically speaking, a data miner can go to as many as six dimensions and still find a visual representation interpretable as a pattern.
The visualization software chosen for this research is POV-Ray. This free software, which is useful in plotting extra dimensions, is available for download (www.povray.org). With respect to oil and gas analysis, POV-Ray can plot one potential profitable relationship, high cumulative production gas well targets against several independent variables within the BC database, such as: regions, well data, location of wells, engineering characteristics, and formational characteristics.
To produce plots in POV-Ray is relatively straightforward. However, some formatting of data is required before POV-Ray can be of use. Ampersands symbolized by "&" in Excel can function to "wrap" POV-Ray code around database data. Data can be either scale or categorical. Categorical data can be plotted by converting each category into a numeric value and then rescaling data between 0 and 1 using a normalization technique discussed below.
The formula in Equation 1 below normalizes data.
null
The process of normalization eliminates scale effects in data and facilitates identification of meaningful relationships in visual data mining plots. The formula in Equation 1 is used for normalization of both scale, (i.e. time series data) and categorical data (i.e., geological rock units and formations). Categorical data are given a number value as a reference, i.e., 1 = formation B, and 2 = formation C. These categories can then be rescaled between 0 and 1. One can also bin data into ranges, i.e. 1 to 5, 6 to 10, etc.
"Original_value" is the value of each time series or numerical categorical code in equation one. The "min" is a minimum value in time series or numerical categorical data, and the "max" is the maximum value in the time series or numerical categorical data. Again, this formula compresses every value between 0 and 1 and eliminates scale effects. The data are now ready to have POV-Ray code wrapped in preparation for plotting.
In Excel, the POV-Ray code is wrapped around each coordinate as shown below:
= "sphere {<"&A6&," "&B6&," "&C6&,"> "&$G$5&" finish {ambient 0.9 diffuse 0.8 phong 1 } pigment { color red "&D6&" green "&E6&" blue "&F6&" }}"
Each data point is referenced to a column in Excel containing additional data points. The code "&$G$5&" is a fixed reference to a cell in order to control the size of each data point sphere from one point. The fixed cell reference also provides a convenient location to allow resizing of data points. The resulting code is transferred through copy and paste into the POV-Ray editor window.
The scenery code is added above the data code, whereby one would then click on the "running man" symbol in the POV-Ray tool bar to begin a visual plot. The scenery code is then used to add visual reference information in addition to providing directional arrows to indicate data orientation when viewing. One can also add a "color dimension" with the code above. Color changes between masses of individual data point spheres may indicate a relationship.
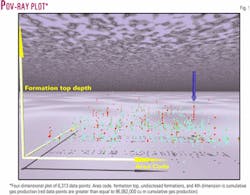
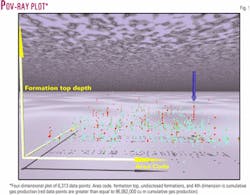
A four dimensional plot of gas data represents all gas wells drilled in BC the past 30 years (Fig. 1). The fourth dimension in this case is not time but rather the cumulative amount of gas produced by gas wells across BC in the past 3 decades. The blue arrow in the figure indicates an area of predictable cumulative gas well patterns indicated by the red colored sphere points.
Any cumulative gas production above the 85th percentile of all cumulative gas production in the BC database is colored red. The 85th percentile is equivalent to 96,062,000 cumulative cu m of gas or greater. The plot in Fig. 1 represents 6,313 gas and oil wells with some data point overlap. Other colors in the plot indicate cumulative gas production below 96,062,000 cumulative cu m.
The depth of the plot or the "going into the page" plane represents the third dimension. In this example, the third dimension is the Z direction according to the POV-Ray coordinate system. The "Z" dimension plots geological formations which contain gas wells situated across BC.
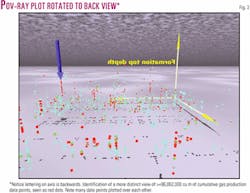
The POV-Ray software functionality gives the data miner an ability to rotate the graph, thereby enabling viewing of data from numerous angles and heights. This allows for a greater inspection of data, and often data miners can find relationships when looking at a certain perspective, above, below, or to the sides of the data.
This plot indicates "linear patterns" in data where a statistical relationship may exist between area codes, certain formation codes, and depths at which the gas producers are found. Notice the "jump discontinuities" in the linear patterns; each line of data points appears to look like grass blades vertically separated from each other. These jump discontinuities naturally occur since the data span over 300 geological formations.
Formations are viewed by going into and out of the page. Moreover, facies changes also insure a different type of jump discontinuity as do structural differences such as fault lines and regional level mountain-forming events. In turn, each geological formation represents a unique category containing subcategorical rock unit information. Note linear patterns of gas well producers tend to run within some unique formations.
These jump discontinuities, along with the higher dimensional relationships in the data (as can be seen by the plot), indicate that traditional XY statistics prove useless in predictive value with respect to geological data. XY statistics can only generate a "two dimensional view," when in fact relationships may exist in three, four, or higher dimensional space.
In the research, greater than two dimensional space is shown in Figs. 1 and 2. Attempting to plot these relationships in XY dimensions results in missed opportunities.
Next week (conclusion): Data mining as a tool to aid oil and gas exploration and economics.
The authors
James Cormier-Chisholm ([email protected]) is founder of Data Forest Mining Inc. and is a data mining consultant and international finance writer. He also owns Chisholm Strategic Consulting, a firm specializing in financial predictive data mining on FOREX, commodity, and bond markets. He has a BS in geology from Acadia University, a diploma of engineering technology from University College of Cape Breton, and an MBA from St. Mary's University.
Christian Sebastian is a consulting analyst in information technology with Electronic Data Systems. Before joining EDS, he consulted in the areas of data mining, informatics, e-commerce, and web development. He has a bachelor of commerce from McGill University and master's degrees from Dalhousie University in business administration and electronic commerce.


