OPEC's challenge: Rethinking its quota system
Perhaps for the first time in its 42-year history, the Organization of Petroleum Exporting Countries has gained the respect of the world oil community as a technically competent organization. It is now seen as an organization capable of managing the fundamentals of the oil market, managing global stocks and movements and refinery throughputs to "achieve stable oil prices which are fair and reasonable for oil producers and consumers," as stated in its primary mission.
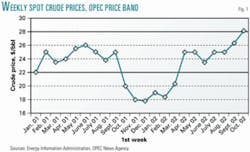
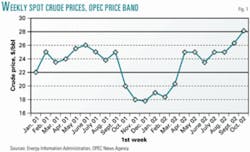
Following the price crash of 1998, when oil prices hit a low of $10/bbl, OPEC put into place a price- band mechanism with the object of maintaining its basket price of seven crude oils within $22-28/bbl by fine-tuning daily output at its discretion.
Since January 2001, OPEC has been very successful in keeping its basket price within the target range (Fig. 1), the exception being the 6 month period following Sept. 11, 2001. During that time OPEC allowed prices to fall to a low of $16/bbl, citing market stability as more important than the price target as the reason for not cutting production to boost prices during that period. As a recent example of its disposition to keep prices in line, OPEC increased production by 760,000 b/d when crude oil prices began climbing through the upper limit of the band at the end of September 2002. By the end of October crude prices had fallen more than 10%, returning to the target range. Since the beginning of January 2002, OPEC has increased its crude oil production by 2.4 million b/d—to 25 million b/d—in fourth quarter 2002. OPEC accounts for roughly 40% of the world's crude oil production and about 77% of its proven reserves. In the context of this report, crude oil is used as the basis for production and reserves data. OPEC uses crude oil and does not include condensates, natural gas liquids, or oil from nonconventional sources as its reference for quotas and ceilings.
How does OPEC handle production cutbacks and increases? Its first attempt to stabilize prices by controlling production came in March 1982 amid falling prices following a severe contraction in world demand during 1980-86. OPEC members agreed upon a ceiling of 18 million b/d, slightly higher than the then-production level of 17.4 million b/d. They also agreed on quotas for each member country and set the ceiling for a 3 month period. The procedure failed many times during the next 4 years. The price of oil continued its freefall to below $10/bbl in the summer of 1986, mainly because various members would produce beyond their quotas.
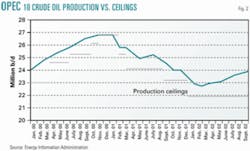
Over the years, the quota system essentially has never worked. On the one hand, OPEC has no way to enforce its members compliance with the agreed-upon quotas, and on the other, there were always members dissatisfied with their assigned quotas. Production generally exceeded the ceiling (Fig. 2) and, in many cases, the excess has been very significant. In its September 2002 meeting, OPEC agreed to stay firm on its ceiling of 21.7 million b/d of crude oil (excluding Iraq) set last March, when in reality current output has been running almost 2 million b/d higher. This curtailed production simply should be reallocated among the member countries. Because of its large production capacity, Saudi Arabia has been the swing producer ever since the quota system was put in place 20 years ago.
The original 1982 quotas were revised several times and were finally suspended in 1986. Following the 1990-91 Persian Gulf crisis, OPEC adjusted the quota system in an attempt to accommodate rising Kuwaiti output following its recovery from the destruction of its oil facilities following Iraq's invasion.
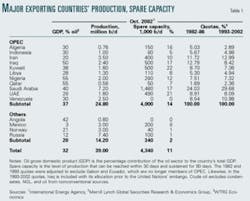
OPEC finally convened in an extraordinary session in September 1993 to revise the country allocations. It made major adjustments to bring members in line with its then-current output capacity. Qatar, Venezuela, Saudi Arabia, and Iran received substantial quota increases (Table 1). All others were adjusted downwards. A new production ceiling was agreed upon for a 6 month period.
Those quota allocations, based on compromises within the framework of a pro rata method proportional to historical production levels, remain in place today. The period of continuous negotiations following the Kuwaiti crisis was traumatic for the organization, and it never readdressed the problem. After almost 10 years, the then-agreed-upon quotas obviously do not reflect the present production capacities of OPEC's members.
Classical proration methods as practiced in the US and Canada are based on verifiable well tests and reserves. They work principally because the regulatory bodies can legally impose compliance. For instance, during the Great Depression (1931-32), rulings of the Texas Railroad Commission regulating oil production in East Texas were being ignored. Then-Gov. Ross Sterling placed several counties under martial law and shut down oil production temporarily.
Obviously, analogous actions are not applicable to sovereign countries, but neither does quota-busting or a boom-bust cycle of oil revenues serve their purpose. OPEC revenues topped $600 billion in 1980, fell to a little over $100 billion in 1998, and should close 2002 at roughly $180 billion.1
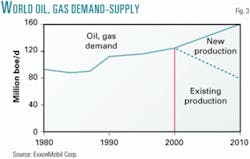
Times have changed in OPEC' s favor. In the world energy outlook for the next decade or so, demand will outstrip supply if timely and substantial new discoveries are not made (Fig. 3). This implies that a revised quota system would have to address the important issue of rewarding discoveries. Constant production caps only handcuff oil companies with investments in OPEC countries and discourage the much-needed large foreign investments required to expand output capacity.
Formula for allocations
In 1986, OPEC conducted an in-depth analysis of its system of allocating quotas with the view of setting up a durable formula, equitable to all members. Members defined eight criteria, falling into two categories—oil related and socioeconomic:
- Reserves.
- Production capacity.
- Historical production share.
- Domestic oil consumption.
- Production costs.
- Dependence on oil exports.
- Population.
- External debt.
However, it is interesting to see some OPEC member views on what they considered the negative features of the various criteria.2 For example, many of the countries consider their reserves a state secret. New discoveries, they claim, could have a sudden and major impact on equity distribution. Production capacity favors the countries rich enough to maintain excess capacity. Historical production share tends to make producers boost production in times of high demand. Domestic oil consumption figures may be difficult to obtain. Uniform treatment of production costs is difficult. Countries with large populations may be assigned quotas in excess of their ability to produce. Dependence on oil revenues will give similar quotas to everyone (Table 1, oil GDPs). And compensations for external debt would imply approval for financial mismanagement. These dilemmas proved too overwhelming to handle, and the quota system remained unresolved.
Two important conclusions can be derived from the above observations. In the first place, the complex socioeconomic differences among the member countries suggest that these parameters be excluded from any allocation formula. Secondly, all of the OPEC members agreed that production capacity provides a practical upper limit on a country's quota. This is fortunate because all bonafide proration systems use pool production potential, or, correlatively, country potential in the OPEC context, as the basis for production allocation. They also provide incentives for exploration, secondary recovery operations, and for pools with low reserves per acre, via bonus allowables.
Rate control is the centerpiece parameter of these systems because proration fundamentally is waste-prevention oriented—control of infill drilling, of wells with high gas-oil ratios, and accelerated reservoir pressure depletion. These fundamental conservation constraints are equally valid for OPEC countries because oil is the backbone of their economies:
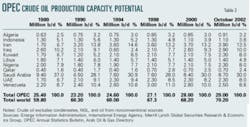
- Production capacity. OPEC's crude oil production capacity has grown 14% in the last 2 decades and currently stands at 29 million b/d—roughly 40% of total world capacity. All member countries, with the exception of Indonesia and Venezuela, have registered moderate to insignificant gains in their crude oil production capacity during the last 5 years.
Indonesia and Venezuela have suffered declines of 200,000 b/d (15%) and 500,000 b/d (17%), respectively, while the capacities of Libya, Qatar, and the UAE essentially have remained unchanged over the same 5 year period. Table 2 summarizes the evolution of crude oil production potential of OPEC's member countries during the last 22 years. The data show a remarkably high level of consistency. Country production capacity data is obtained through surveys conducted by several well-known international agencies and therefore can provide a reliable starting point for evaluating allocation formulas.
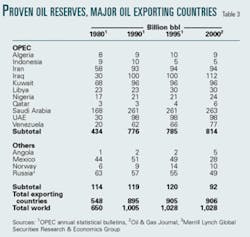
- Reserves. Another important oil-related factor that could be considered in an allocation formula would be proven reserves. However, reserves figures from OPEC member countries (Table 3) reflect a bumpy trend. During the 1980s, OPEC's proven crude oil reserves increased by 80%.
Many of the countries upped their 'book' reserves, in some cases by a factor of three (Iraq, UAE, and Venezuela), to position themselves in anticipation of a quota system. As a consequence of these accounting practices, most of the countries with large reserves, notably, Iran, Iraq, Kuwait, Saudi Arabia, UAE, and Venezuela, share an abnormally high reserves:production ratio, reflected in the slopes of the correlations in Fig. 4.
The ratio is well out of line with other major oil producing nations such as Mexico, Norway, Russia, the UK, and the US. It therefore should come as no surprise that because of these manipulations over the years, the reserves parameter, as such, has lost its usefulness for any quota system. What is more critical, perhaps, is that these anomalies limit severely the entrance of other oil exporting countries into the OPEC fold.
- New discoveries. The only remaining oil-related variable of importance to the OPEC quota system is new discoveries. It is fundamental to incorporate incentives for foreign investments in exploration and development. The Middle East is, at this time, the most important oil region capable of making significant contributions to the forthcoming oil supply deficit when world production peaks3 sometime in the next decade or two.
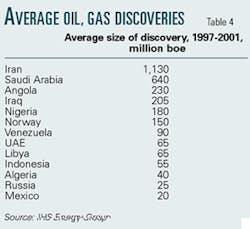
During 1997–2001, there have been discoveries of new oil and gas fields in some 30 countries around the world, with an average-size find of 295 million boe of proven reserves. The range of the finds varies from under 20 million bbl of oil in countries such as Ghana, Colombia, and Germany to 1.9 billion bbl in Kazakhstan. In the case of OPEC, nine member countries (Table 4) registered new discoveries, ranging in size from 1.13 billion bbl in Iran to 40 million bbl in Algeria. The average OPEC find contained 275 million boe.
In order to tie new discoveries into an allocation formula, it is necessary to establish a suitable relationship between reserves and field productivities. As pointed out previously, the differences between the correlations of the reserves:production potential data for the OPEC and non-OPEC countries are significant.
A comparison of the slopes of the trend lines in Fig. 4, indicates that OPEC reports almost five times the reserves required to sustain the same output level. In this study, the correlation of the non-OPEC countries is used because it is more consistent with well-documented average productivities of new field discoveries, both in the Middle East and in other regions.4,5 Moreover, it would assign more-favorable allocations to all of the OPEC member countries.
From Fig. 4, the derived relationship between discoveries and production potential is:
Equation 1
Qomax = 180R
Where:
Qomax is the theoretical maximum rate potential expressed in barrels per day of oil, and R is the size of the discovery in millions of barrels of proven reserves.
For example, a find with 1 billion bbl of proven oil reserves would generate a production potential of 180,000 b/d. However, since this output generally will take 5 years or more to go on stream,5 it is highly desirable to give the country an early credit for the find, equivalent to 50% of the theoretical output, in the year following the discovery and for a duration of 5 years. The remaining 50% gradually will be phased into the country's output potential as the field is developed.
Equation 2
This early credit or bonus production, Qob, is calculated by modifying Equation 1 to the following:
Qob = 90R
- The general allocation formula. OPEC is constantly analyzing short-term market demand and crude oil spot prices with the object of controlling production output to keep its basket price within the price band. These output ceilings, reflecting cutbacks or production increases, are established periodically—monthly or every 3 months— according to market fluctuations. The quota system is needed to distribute the output ceiling among the member countries, assigning production aliquots to each member.
Equation 3
The country aliquots are determined by the following algorithm:
QAi =Qcapi (Qc – Qobt) + Qobi
Where:
QAi is the country aliquot expressed in Million b/d.
Qcapi is the basic country quota expressed as a fraction of the total OPEC output capacity.
Qobi is the country's bonus quota for new field discoveries, Million b/d.
Qobt is the total OPEC bonus quotas, Million b/d.
Qc is the established production ceiling, Million b/d.
i is the country index.
In calculating the basic country allocation: Qcapi( Qc – Qobt) in the above formula, the total bonus quotas are subtracted from the production ceiling. This guarantees that production cutbacks will be distributed equitably among all members. The bonus quotas are subsequently added to each member allocation. This preserves the reward nature of the bonus for successful exploration efforts.
Equation 3 can now be used to analyze two hypothetical cases:
- OPEC sets a production ceiling equivalent to its October 2002 crude oil production.
- What happens when new members join the organization.
Results and analysis
By way of illustration, the proposed quota system is applied to the crude oil production situation in OPEC as of October 2002. The basic quota is calculated, using the current output capacity of each member country.
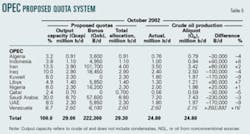
In addition, a bonus allocation is assigned to those countries that had new discoveries in the previous year, using the field productivity Equation 2. In this example, the new discoveries in Table 4 were used to calculate the respective country bonuses, which total 222,300 b/d. The total country allocation is the sum of the basic and bonus allocations. The production aliquots are calculated using Equation 3. OPEC's crude oil production of 24.8 million b/d in October 2002, was assumed to be the newly set production ceiling.
In synthesis, the results, summarized in Table 5, indicate that five OPEC countries are producing above their quotas, and six below. The average deviation from the allowables was 6% for the overproducers and 5% for the underproducers. Oil wells, as a matter of practicality, may overproduce one day and underproduce the other. Moreover, in the case of secondary recovery projects, frequent rate variations are not desirable from a technical point of view. In typical proration systems, permissive tolerance of overproduction is limited to 125% of the allowable for the pool. Such excess production, however, must be compensated for, normally in the following month. At the country level, however, as is the case of OPEC, a reasonable period of reposition may be the following trimester. An oversight committee should be charged with monitoring these situations.
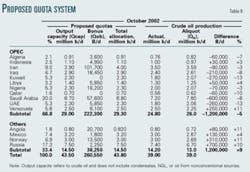
What if other exporting countries should join OPEC? To investigate this hypothesis, the quota system was extended to include four important oil-exporting countries: Angola, Mexico, Norway, and Russia. The results of the simulation are shown in Table 6. The new expanded group of 15 countries has a total crude oil production potential of 43.5 million b/d, roughly 50% higher than OPEC's.
The assumed production ceiling is 39 million b/d, equivalent to the current (October 2002) crude oil production of the 15 countries. There are 13 countries with new field discoveries, with a total bonus of 260,550 b/d. Seven countries are overproducers, averaging 9% above their aliquots, and there are eight underproducers averaging 7%. These averages are very reasonable.
It is of interest to see how the two groups were affected by the integration. The new group of four countries received a total aliquot of 13.0 million b/d, 1.2 million b/d less than their production before integration. The OPEC group was favored by the same amount. This is so because the OPEC group has a much larger spare capacity than the new group, and the quota algorithm tends to seek equilibrium among all of the members, shifting allocations from countries with little spare capacity to those with more flexibility. Before integration, the group of four was producing at 98% capacity compared with 86% for OPEC. The expanded group, after integration, was producing at 90% of their total capacity.
Conclusions
OPEC set up its original quota system in 1982, prorating its production ceiling in accordance with each country's output capacity. These initial country quotas were revised several times and finally suspended in 1986.
In 1993, following the Iraq-Kuwait crisis, OPEC readdressed the problem, adjusting the quota distributions to the then-upgraded production potentials of the member countries. After almost 10 years, these same quotas remain in place today.
The highlights of a proposed new quota system is as follows:
The backbone of the system is the country crude oil output capacity that can be reached in 30 days and remain sustainable for at least 90 days.
These are prorated to generate the basic quota of each member country. It is recommended that each country produce its maximum potential, at least once a year for 30 days. An oversight committee would coordinate the programming of these production potential "tests."
In addition, an early bonus allowable is provided for new field discoveries. This bonus, equivalent to 50% of the theoretical potential of the reserves discovered, is added to the country's basic output quota in the year following the discovery, and remains in place for 5 years.
The quotas are to be updated annually.
Evidently, the success of this honor system will depend on the will of the member countries to make it work. The lifetime of the system is foreseen to be about 20 years, after which there should be no need for quotas as the world demand-supply relationship would begin to tip in favor of demand.
Finally, the simplicity, transparency, and efficacy of the proposed quota system should facilitate the decision of other oil exporting countries to join the OPEC organization. This expansion would provide an even more efficient base to keep prices in line for the benefit of all parties—producers and consumers. The events surrounding the current Iraq situation would seem to suggest the convenience of putting in place the proposed quota system in the very near future.
Acknowledgments
My thanks go to the London oil and gas team of Merrill Lynch Global Securities Research & Economics Group and to Pete Stark (IHS Energy, Denver) for providing valuable data for this research and for their valuable suggestions during the course of this study.
References
1. Energy Information Administration.
2. An excellent discussion of the deliberations is given in "OPEC Issues," Center for Global Energy Studies, London, 1999.
3. Deffeyes, Kenneth S., "Hubbert's Peak," Princeton University Press, 2001.
4. Global Octane-2001, Merrill Lynch Global Securities Research & Economics Group, October 2002
5. "Oil production capacity expansion costs for the Persian Gulf," Energy Information Administration, January 1996.
The author
Rafael Sandrea ([email protected]) is president and CEO of ITS Servicios Técnicos, a Caracas-based engineering company he founded 28 years go. He holds a PhD in petroleum engineering from Penn State University and has written more that 25 technical publications, including the book Dynamics of Petroleum Reservoirs under Gas Injection, Gulf Publishing, 1974.
