The US will consume more energy this year, but high prices will limit both economic growth and oil and gas demand.
Strong natural gas prices will keep gas consumption even with last year's level, while fuel switching will move some demand toward petroleum products. US marketed gas production will be slightly higher than a year ago, minimally helping to ease the tight gas market.
OGJ forecasts that US oil demand will increase nearly 3% this year. Leading this increase are surges in the use of distillate and residual fuel oil. Increased product demand is boosting refining capacity utilization. This year will also see increases in US demand for coal and other sources of energy.
Worldwide oil demand will move up, though not as much as supply, so inventories of oil will catch up a bit after falling sharply.
US production of crude and condensate will be nearly unchanged from last year, and NGL production will decline. More imports will meet the excess demand.
International market
Reported inventory levels, the state of the Iraqi oil industry, and the target output ceiling for the Organization of Petroleum Exporting Countries are the key issues driving the international market.
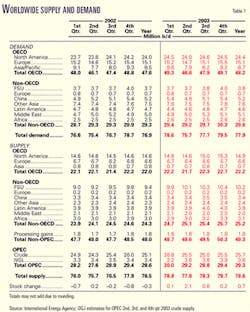
International Energy Agency estimates indicate that worldwide demand will increase 1 million b/d this year. The Paris-based agency recently reallocated demand to place more growth in the second half of the year, as the impact of Severe Acute Respiratory Syndrome (SARS) on jet fuel demand and generally weak transport fuel demand growth accounted for a weaker first half.
Demand for petroleum products in Organization for Economic Cooperation and Development countries was up 1.3 million b/d from a year earlier in the first quarter and up 500,000 b/d in the second quarter.
IEA estimates third quarter demand at 47.9 million b/d and fourth quarter demand at 49.1 million b/d. This would translate into second half growth of 400,000 b/d over a year ago. The largest increase in this group comes from North America, where 2003 demand is pegged at 24.4 million b/d, up from 24 million b/d last year.
Non-OECD demand will move up 300,000 b/d from last year. Most regions will post small increases, but Latin American non-OECD demand will fall to 4.6 million b/d from 4.7 million b/d.
Supply will exceed demand this year, resulting in an inventory build of 700,000 b/d. OGJ estimates that total supply will be 78.6 million b/d compared to 76.5 million b/d last year.
Among the OECD countries, supply from North America will be up, while European output is flat and Asian supply declines. IEA estimates that among countries that belong to neither OECD nor OPEC, supply will increase 900,000 b/d. Accounting for almost all of that change, supply from the former Soviet Union will average 10.2 million b/d vs. 9.4 million b/d last year.
OPEC
Following the war in Iraq, production in that country got off to a shaky start. Sabotage and looting hampered efforts to return exports to prewar levels, although the goal of the US-led coalition to restore Iraq's oil industry is to ramp up production to at least 1.5 million b/d by the end of the year.
Because of the delay, OPEC has not come under any pressure to reduce its output ceiling, as prices have stayed in the upper half of its self-imposed price band of $22-28/bbl. The organization called an extraordinary meeting for June 11 in anticipation that it would need to cut output targets in the wake of extra supply from Iraq. Instead, OPEC took no action at that meeting.
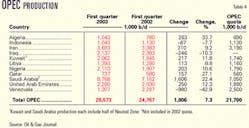
The last time that production levels were changed was at OPEC's April meeting, when the production target, which excludes Iraqi exports, was reduced 2 million b/d to 25.4 million b/d effective June 1.
IEA reported that OPEC supplied 26.8 million b/d of crude in the first quarter of this year. NGL output of 3.2 million b/d made the market balance with little change in stocks.
For the second quarter, OGJ estimates that OPEC output was 25.5 million b/d, allowing for a 2 million b/d stockbuild. In the second half of this year, the organization will most likely hold output relatively steady, sacrificing market share for the sake of shoring up prices. Otherwise, it will have to reevaluate its price band.
Crude oil prices
Tensions in the Middle East and tight supplies drove up crude oil prices in the first half of this year. Talk of a US-led war with Iraq began to lift oil prices in mid-2002, and the war premium was estimated to be as high as $8/bbl. Additionally, low stocks of oil were exacerbated when a general strike in Venezuela and ethnic violence in Nigeria reduced exports from those countries.
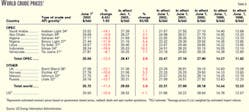
The average world export price of oil averaged $27.24/bbl for the first 5 months of this year compared with $21.63/bbl for the same period last year. For all of 2002, the average world export price of crude was $23.65/bbl.
The oil futures market has put a premium on prompt deliveries of crude, but near-month contracts have moderated since the war in Iraq in March and April.
When it was the front-month contract, the average price for delivery of January crude on the New York Mercantile Exchange (NYMEX) was $27.79/bbl. The average price moved up to $32.21/bbl for February, $34.46/bbl for March, and $35.61/bbl for April, then subsided to $29.02/bbl for May.
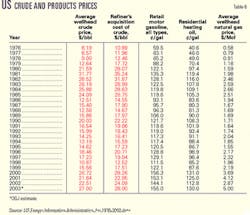
The average US wellhead price of oil for the first quarter of this year surged to $30.09/bbl, up from $17.62/bbl for the same period last year and $24.30/bbl the prior year. The wellhead price climbed as high as a monthly average of $31.85/bbl for February. OGJ projects that this year's average wellhead price of crude will be $27/bbl.
Product prices
The OGJ weekly survey of US self-service unleaded motor gasoline pump prices shows a nationwide increase for the first half of the year to $1.57/gal from $1.31/gal in the first half of last year and equal to the price for the same period in 2001.
OGJ's survey also indicated that excluding all local, state, and federal taxes, the average pump price for the first 6 months of this year was $1.17/gal vs. 86¢/gal for the same period last year and $1.14/gal the previous first half.
For 2002 the average US pump price was $1.30/gal, according to the US Energy Information Administration. OGJ predicts that the average pump price will be $1.55/gal this year.
The gasoline market in California is tight following unplanned refinery shutdowns and the transition to ethanol from MTBE. These factors combined to prop up that state's average gasoline price to 45-50¢/gal higher than the national average at the beginning of the summer driving season, said EIA in its June Short Term Energy Outlook.
OGJ forecasts that residential heating oil prices will average $1.30/gal this year, up from $1.13/gal last year. Low stocks combined with colder weather drove up the US average price of residential heating oil to $1.51/gal in February, whereas the winter of 2002 was milder, and stocks were higher than usual then.
Natural gas prices
Low inventories during and following the US winter heating season have driven up gas prices. Production and import declines came at the same time as the cold hit, escalating supply fears.
The futures price of gas on the NYMEX hit a 2003 high of $9.577/MMbtu on Feb. 25 for the March delivery contract. The March contract closed the following day at $9.133/MMbtu.
Since then prices have moderated but are not expected to reach the previously normal range of $1.50-2.50/MMbtu. The average price of gas on the NYMEX from 1990 through 1999 was $2.03/MMbtu.
The NYMEX gas contract closed at $5.146/MMbtu for April delivery and $5.123/MMbtu for May delivery. Then, in anticipation of the summer cooling season, gas futures bounced back up to close out the June contract at $5.945/MMbtu. The July contract closed on June 26 at $5.291/MMbtu.
The US wellhead gas price averaged $4.47/MMcf in January, up from $2.35/MMcf a year earlier. More recent monthly figures were not available at press time, but OGJ forecasts that for 2003, the wellhead price will average $5/MMcf.
US economy
OGJ's US energy forecast is based on the assumption that real gross domestic product (GDP) will increase 2% this year. GDP increased 2.4% last year and 0.3% in 2001. This year will be the 12th consecutive year of economic growth, following a short recession that started in late 1990.
New York-based research group the Conference Board reported that its Index of Leading Economic Indicators rose 1% in May, the largest increase since December 2001. The index, which aims to predict the economy's direction in the next 6-9 months, moved up slightly in April.
"This increase was largely due to stock prices, real money supply, and consumer expectations, but most other components also increased slightly. It is possible that these two consecutive increases reflect the beginning of an upward trend, thereby ending the flat trend that began in early 2002," the Conference Board reported.
First quarter 2003 GDP grew at an annual rate of 1.4%. OGJ expects growth to pick up momentum in the second half of the year based on several factors, including rising stock prices. Additionally, the falling dollar should help increase US exports, interest rates are keeping borrowing costs down, and the housing market continues to show remarkable strength.
The Federal Reserve reported that industrial production edged up 0.1% in May after falling 0.6% in both March and April. This latest figure remains below the May 2002 level, however. Capacity utilization for total industry, the Fed reported, was unchanged from April at 74.3%, a rate seven percentage points below its 1972-2002 average.
The Federal Open Market Committee (FOMC) decided late last month to lower the federal funds rate for the first time since Nov. 6, 2002, to 1% from 1-1/4%. This is the lowest that the rate has been in 45 years. Driving this adjustment was the fact that the economy had yet to exhibit sustainable growth. Also, the probability of a substantial fall in inflation exceeded the probability of a pickup in inflation from its already low level, the FOMC said.
The latest available data show that the unemployment rate has failed to level off yet. The most recent statistics released by the Department of Labor's Bureau of Labor Statistics indicate that unemployment in May rose to 6.1% from 6% in April and 5.8% in March. This is the highest rate since July 1994.
US energy demand
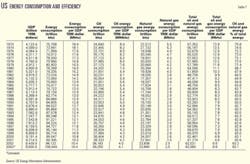
The small boost in the economy will mean that the US will demand more energy this year. More energy will be required for transportation and electric power generation. OGJ forecasts that total energy demand will be 100 quadrillion BTU (quads), increasing at the same annual rate as GDP.
Energy consumption increased in 2000 to 99 quads from 96.8 quads, then declined to 96.4 quads in 2001. Last year total US energy consumption partially rebounded to 98.1 quads.
Energy efficiency, measured as the amount of energy consumed per dollar of GDP, will be unchanged from last year at 10,390/$1. This ratio has improved each year since 1970, when the energy efficiency ratio was 19,800/$1.
Energy by source
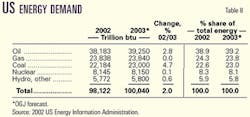
US energy demand will increase in 2003 for all sources except gas. Oil will continue to dominate the energy market, while coal consumption creeps up to nearly the same level as gas (Table 8).
Oil energy consumption will increase 2.8% this year following a 0.4% decline last year. With demand at 39.25 quads, petroleum's share of the energy market will be 39.2%, up from 38.9%.
Meanwhile, gas energy consumption will be unchanged from a year ago as consumers switch to less costly fuels where it is possible. Gas faces competition in the electric utility sector from coal, nuclear, and hydroelectric power. Demand for coal, mainly for power generation, will increase 3.7% to 23 quads, so gas will lose market share as coal consumption rises.
The use of coal has been rising along with electric power consumption, but demand growth for this fuel continues to be restrained by environmental concerns and related costs of clean air regulations.
The combined market share for oil and gas this year will be 63%, down from 63.2%. Coal will comprise 23% of the total energy market vs. 22.6% a year ago.
Energy from nuclear power will be nearly the same as last year at 8.15 quads. The number of operable units in the US stands at 104, the same since 1998. The number of operating nuclear units peaked in 1990 at 112, although capacity peaked in 1996 when 109 units were operating.
Still, the amount of electricity generated by nuclear units has been on the rise. Nuclear electricity net generation was 577 billion kw-hr in 1990, 675 billion kw-hr in 1996, and 780 billion kw-hr last year. In 2002, nuclear's share of total US electricity net generation was 20.3%. Capacity utilization last year was 90.4%.
Consumption of energy from hydroelectric power and all remaining sources will be little changed from last year at 5.8 quads. This category includes wood, waste, alcohol fuels, geothermal, solar, and wind power.
Hydroelectric power demand was 2.66 quads last year and is on pace to be about the same this year, according to the most recent statistics. In 2001, hydro supplied 2.2 quads of energy, down from 2.8 the previous year because of unusually dry weather in the Northwest. Drier-than-normal weather has prevailed for several years, as hydroelectric power use exceeded 3 quads in the late 1990s.
Natural gas market
Natural gas demand in the US got a boost at the beginning of this year when cold winter weather took hold. But OGJ forecasts that for the year, gas consumption will be unchanged from 2002 as high prices erode demand, most noticeably in the industrial sector.
The amount of gas in storage has been the focus of the market so far this year, as storage levels have stayed below the 5-year average range since March. At the end of February the amount of working gas in storage was 974 bcf. That was 53% lower than a year earlier, when stocks were at the top of their 5-year average.
For the 2002-2003 heating season, gas storage levels shrank an estimated 2.5 tcf. This compares with a draw of 1.6 tcf for the same period a year earlier and 2 tcf for the 2000-2001 heating season.
The normal average number of gas home heating degree-days for November through March is 3,860. For the 2002-2003 heating season, the number of heating degree-days was 3,709, up from 3,264 a year earlier.
The amount of gas delivered to residential consumers in January was 946 bcf, up from 821 bcf in January of last year and down from 977 bcf during the same month in 2001.
For the week ended June 20, the latest data available at press time, stocks of working gas increased to 1,550 bcf; this is 500 bcf below the 5-year historical range.
Stocks should be sufficient heading into the next heating season, as one factor that will ease supply pressures is waning industrial demand, which is more price-sensitive than residential or commercial demand. Total industrial gas consumption last year declined to 7.12 bcf from 7.36 bcf in 2001 and 8.14 bcf in 2000.
Meanwhile, the amount of gas supplied to electric power providers has been climbing, as most new generators are gas-fired combined cycle units. Total gas supplied to these consumers was 5.55 bcf last year vs. 5.34 bcf last year and 5.21 bcf a year earlier. Electric power providers consumed 4.82 bcf of gas in 1999, up from 4.59 bcf in 1998 and 4.07 bcf in 1997.
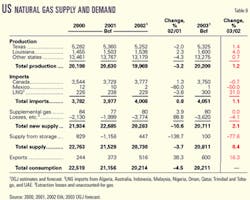
OGJ forecasts that production of gas in the US will increase this year to 20.2 bcf, a gain of 1.2% from last year. Deepwater production gains will offset high depletion rates on the Gulf of Mexico shelf, although the National Oceanic and Atmospheric Administration outlook indicates a 55% probability of an above-normal Atlantic hurricane season in 2003. The outlook calls for 11-15 tropical storms with 6-9 becoming hurricanes and 2-4 becoming major hurricanes. Any of this activity could reduce output from the GOM, as it did last September and October.
Additional gas production from Wyoming via the Kern River pipeline has come on stream this year. The once-idle production units there are now able to supply western markets after pipeline expansions have been completed, more than doubling capacity of the pipeline system.
Additional production is expected to come online from new wells in the Bossier trend of East Texas and North Louisiana and from drilling in the Barnett shale of North Texas. For the week ended June 27, the Baker Hughes Inc. count of active rotary rigs showed that 86% of all rigs in the US were being used to drill for gas, and only 11% of those were located in the GOM.
Imports of liquefied natural gas (LNG) will be up this year. So far, the data indicate that imports from Trinidad and Tobago have increased, and OGJ projects that in total the US will import 300 bcf of LNG in 2003. Imports of gas from Canada and Mexico will be slightly lower.
US petroleum demand
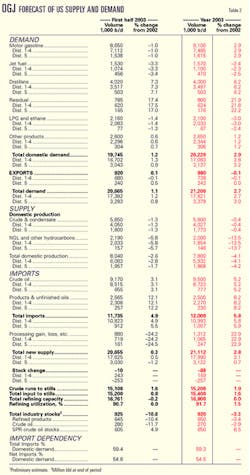
This year's high gas prices are causing quite a bit of fuel switching to oils. Total demand for petroleum products in the US this year will be 20.22 million b/d, up from 19.66 million b/d last year.
Motor gasoline demand will remain strong, and residual fuel oil consumption will surge. Jet fuel demand will continue to sag. The use of LPG and ethane will decline, and exports will be nearly unchanged from a year ago.
US consumption and exports of crude and products will total 21.2 million b/d, up from 20.64 million b/d.
Jet fuel
Jet fuel demand will drop 2.8% this year as air travel remains suppressed in the ailing economy. Most airlines have continued to consolidate flight schedules. Air travel declined during the first half of the year in the wake of SARS and the war in Iraq.
According to EIA estimates, jet fuel demand for the first 4 months of this year trailed that for the same period last year by 44,000 b/d. OGJ projects that jet fuel demand will average 1.57 million b/d this year.
Following a steady build, demand for jet fuel peaked in 2000 at 1.725 million b/d then fell to 1.656 million b/d the next year following the Sept. 11, 2001, terrorist attacks.
Motor gasoline
US demand for motor gasoline will increase nearly 3% this year to 9.1 million b/d. The average price of gasoline during the first half of 2003 was about 30¢ higher than for the same period last year.
In a struggling economy, this will hold demand in check. Drivers are taking fewer and shorter trips this summer, also. But the gain in demand will come as many travelers remain reluctant to fly and choose to travel by automobile rather than airplane.
Residual fuel oil
Demand for residual fuel oil will move up 22% because of fuel switching. High gas prices are leading industrial consumers and utilities to switch their fuel to resid from gas when it is feasible. Resid consumption is forecast at 800,000 b/d this year.
Resid demand peaked in 1977 at 3.1 million b/d. A reduction in demand by the electric utility and industrial sectors caused a sharp drop in demand in the years since then as nuclear power output increased, as did price competition from coal and gas.
Distillate
Increased use for industrial production and transportation will boost consumption of distillate this year. Like that for resid, demand for distillate will gain because it is now cheaper than gas.
Distillate demand peaked in 2001 at 3.85 million b/d then declined with the overall economy to 3.77 million b/d last year. OGJ forecasts that distillate demand will rebound to 4 million b/d this year.
At the beginning of the year, demand for distillate as home heating oil soared over last year's levels when cold winter weather took hold. EIA reported that February's demand for distillate totaled 4.4 million b/d, up from 3.7 million b/d during the same month last year.
LPG, other products
US demand for liquid petroleum gas (LPG) and ethane will decline to 2.1 million b/d this year. The decline is based on reduced consumption of the fuel by petrochemical plants, as some petrochemical companies move operations out of the US due to weak market conditions (OGJ Online, June 16, 2003).
Demand for all other petroleum products will be nearly unchanged at 2.65 million b/d. While use of these products, such as asphalt and lubricants, will get a small boost from US economic recovery, a decline in petrochemical production will temper demand growth.
US petroleum supply
Total US liquids production will decline 4% this year to 7.8 million b/d following a slight increase last year. Crude and condensate output will be little changed, but production of NGL will fall 13.5%.
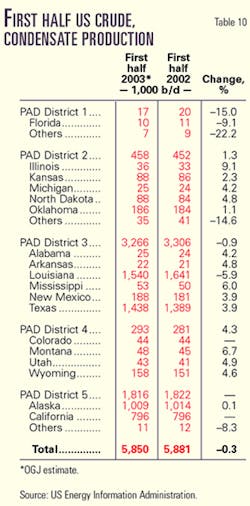
US crude and condensate production has been stagnant over the past few years. Output in 2003 will average 5.8 million b/d vs. 5.824 million b/d last year. In 2001, average production was 5.801 million b/d, down from 5.822 million b/d the previous year.
Alaskan production of crude and condensate slipped each year since 1991—until last year. Alaskan field production averaged 984,000 b/d last year, up from 963,000 b/d a year earlier. Estimates through April show this year's average production lagging last year's, however.
ConocoPhillips Alaska and Anadarko Petroleum Corp. have reported plans to increase the oil production capacity of Alpine field on Alaska's North Slope by 5,000 b/d beginning in late 2004. Alpine field currently produces 100,000 b/d of oil.
US production of NGL will decline to 2 million b/d from 2.3 million b/d last year. As was the case in early 2001, strong gas prices are making it uneconomical to extract the liquids from the gas stream.
For the first 4 months of 2003, EIA data show that NGL production has declined to average 1.765 million b/d compared to 1.886 million b/d for the same period of last year and 1.697 million b/d a year earlier.
Imports
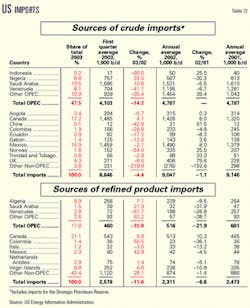
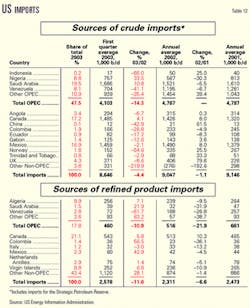
To help satisfy demand, total US industry petroleum imports will increase this year. Excluding imports of crude for the Strategic Petroleum Reserve, imports of crude and products will average 12 million b/d. This is a 6% increase from last year.
Crude will comprise 9.5 million b/d of imports compared to 9 million b/d last year. Crude imports peaked at 9.3 million b/d in 2001, having risen steadily since 1991.
The US imported most of its crude from Saudi Arabia last year. At 1.52 million b/d, Saudi Arabian imports were followed by imports from Mexico of 1.49 million b/d, crude imports from Canada of 1.43 million b/d, and crude imports from Venezuela of 1.2 million b/d.
OGJ forecasts that buoyed by strong demand for gasoline and distillate, product imports will also increase this year to 2.5 million b/d from 2.3 million b/d. For the first 4 months of 2003 product imports led those of the same period last year by an average 295,000 b/d.
Last year, the source of the most product imports was Canada, which exported 513,000 b/d to the US. Following Canada were Algeria, the US Virgin Islands, and Venezuela.
Total imports supplied 58% of the US petroleum market last year. OGJ expects this year's total import dependency to be 59%.
Imports of crude for the SPR last year averaged 16,000 b/d, up from 11,000 b/d a year earlier. Through April, no crude had been imported for the SPR this year.
Stocks
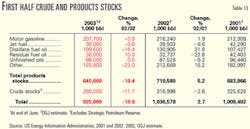
SPR stocks stood at 599.1 million bbl at the end of 2002, up from 550 million bbl at the end of the previous year. At the end of June, SPR stocks had moved up a bit more to 606 million b/d. The SPR continues to be replenished following a fourth quarter 2000 draw that reduced inventories to 541 million bbl.
Industry stocks of crude oil ended 2002 at 277.7 million bbl, their lowest end-of-year level since 1975. Crude stocks have increased a bit since then, ending the first half of this year at 280 million bbl. OGJ expects that crude inventories will end this year at 270 million bbl.
Product inventories have trended lower than usual as well. Product stocks declined 136,000 b/d last year. Motor gasoline inventories ended June at 208 million bbl, down from 218 million bbl a year earlier. Distillate stocks were 110 million bbl at the end of June, down from 130 million bbl a year earlier.
OGJ expects that product stocks will stand at 650 million bbl at the end of this year, down from 674 million bbl at the end of 2002. SPR stocks are forecast to build to 650 million bbl by yearend.
Refining
Despite high utilization rates, low product stocks—especially of gasoline and distillate—sustained healthy refining margins early this year.
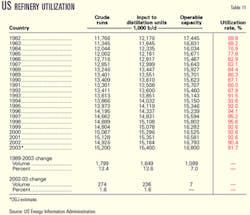
Refining utilization rates during May reached levels not seen in 2 years, reported API. At 95.3%, the May utilization rate was nearly four percentage points higher than a year earlier. API cites the distillate market as the driver in this increase, as gasoline output has declined 2% over the first 5 months of the year. Capacity utilization will be just under 92% for the year, according to OGJ projections.
The refining margin for US Gulf Coast refiners processing West Texas Sour was $10.10/bbl in February, according to Pace Consultants Inc. Margins have moderated somewhat since then but remain above year-ago levels. The March margin was $8.21/bbl, and the April margin was $5.80/bbl.
The cash operating margin for Gulf Coast refiners, according to Muse, Stancil & Co., was $2.55/bbl in May, down from $4.13/bbl in April.
The average refiners' acquisition cost of crude during the first 4 months of this year was $30.36/bbl compared to $20.49/bbl for the same period last year. OGJ forecasts that for all of 2003, the refiners' acquisition cost of crude will average $28/bbl.
Source: International Energy Agency; OGJ estimates for OPEC 2nd, 3rd, and 4th qtr 2003 crude supply.
The US will consume more energy this year, but high prices will limit both economic growth and oil and gas demand.
Strong natural gas prices will keep gas consumption even with last year's level, while fuel switching will move some demand toward petroleum products. US marketed gas production will be slightly higher than a year ago, minimally helping to ease the tight gas market.
OGJ forecasts that US oil demand will increase nearly 3% this year. Leading this increase are surges in the use of distillate and residual fuel oil. Increased product demand is boosting refining capacity utilization. This year will also see increases in US demand for coal and other sources of energy.
Worldwide oil demand will move up, though not as much as supply, so inventories of oil will catch up a bit after falling sharply.
US production of crude and condensate will be nearly unchanged from last year, and NGL production will decline. More imports will meet the excess demand.
International market
Reported inventory levels, the state of the Iraqi oil industry, and the target output ceiling for the Organization of Petroleum Exporting Countries are the key issues driving the international market.
International Energy Agency estimates indicate that worldwide demand will increase 1 million b/d this year. The Paris-based agency recently reallocated demand to place more growth in the second half of the year, as the impact of Severe Acute Respiratory Syndrome (SARS) on jet fuel demand and generally weak transport fuel demand growth accounted for a weaker first half.
Demand for petroleum products in Organization for Economic Cooperation and Development countries was up 1.3 million b/d from a year earlier in the first quarter and up 500,000 b/d in the second quarter.
IEA estimates third quarter demand at 47.9 million b/d and fourth quarter demand at 49.1 million b/d. This would translate into second half growth of 400,000 b/d over a year ago. The largest increase in this group comes from North America, where 2003 demand is pegged at 24.4 million b/d, up from 24 million b/d last year.
Non-OECD demand will move up 300,000 b/d from last year. Most regions will post small increases, but Latin American non-OECD demand will fall to 4.6 million b/d from 4.7 million b/d.
Supply will exceed demand this year, resulting in an inventory build of 700,000 b/d. OGJ estimates that total supply will be 78.6 million b/d compared to 76.5 million b/d last year.
Among the OECD countries, supply from North America will be up, while European output is flat and Asian supply declines. IEA estimates that among countries that belong to neither OECD nor OPEC, supply will increase 900,000 b/d. Accounting for almost all of that change, supply from the former Soviet Union will average 10.2 million b/d vs. 9.4 million b/d last year.
OPEC
Following the war in Iraq, production in that country got off to a shaky start. Sabotage and looting hampered efforts to return exports to prewar levels, although the goal of the US-led coalition to restore Iraq's oil industry is to ramp up production to at least 1.5 million b/d by the end of the year.
Because of the delay, OPEC has not come under any pressure to reduce its output ceiling, as prices have stayed in the upper half of its self-imposed price band of $22-28/bbl. The organization called an extraordinary meeting for June 11 in anticipation that it would need to cut output targets in the wake of extra supply from Iraq. Instead, OPEC took no action at that meeting.
The last time that production levels were changed was at OPEC's April meeting, when the production target, which excludes Iraqi exports, was reduced 2 million b/d to 25.4 million b/d effective June 1.
IEA reported that OPEC supplied 26.8 million b/d of crude in the first quarter of this year. NGL output of 3.2 million b/d made the market balance with little change in stocks.
For the second quarter, OGJ estimates that OPEC output was 25.5 million b/d, allowing for a 2 million b/d stockbuild. In the second half of this year, the organization will most likely hold output relatively steady, sacrificing market share for the sake of shoring up prices. Otherwise, it will have to reevaluate its price band.
Crude oil prices
Tensions in the Middle East and tight supplies drove up crude oil prices in the first half of this year. Talk of a US-led war with Iraq began to lift oil prices in mid-2002, and the war premium was estimated to be as high as $8/bbl. Additionally, low stocks of oil were exacerbated when a general strike in Venezuela and ethnic violence in Nigeria reduced exports from those countries.
The average world export price of oil averaged $27.24/bbl for the first 5 months of this year compared with $21.63/bbl for the same period last year. For all of 2002, the average world export price of crude was $23.65/bbl.
The oil futures market has put a premium on prompt deliveries of crude, but near-month contracts have moderated since the war in Iraq in March and April.
When it was the front-month contract, the average price for delivery of January crude on the New York Mercantile Exchange (NYMEX) was $27.79/bbl. The average price moved up to $32.21/bbl for February, $34.46/bbl for March, and $35.61/bbl for April, then subsided to $29.02/bbl for May.
The average US wellhead price of oil for the first quarter of this year surged to $30.09/bbl, up from $17.62/bbl for the same period last year and $24.30/bbl the prior year. The wellhead price climbed as high as a monthly average of $31.85/bbl for February. OGJ projects that this year's average wellhead price of crude will be $27/bbl.
Product prices
The OGJ weekly survey of US self-service unleaded motor gasoline pump prices shows a nationwide increase for the first half of the year to $1.57/gal from $1.31/gal in the first half of last year and equal to the price for the same period in 2001.
OGJ's survey also indicated that excluding all local, state, and federal taxes, the average pump price for the first 6 months of this year was $1.17/gal vs. 86¢/gal for the same period last year and $1.14/gal the previous first half.
For 2002 the average US pump price was $1.30/gal, according to the US Energy Information Administration. OGJ predicts that the average pump price will be $1.55/gal this year.
The gasoline market in California is tight following unplanned refinery shutdowns and the transition to ethanol from MTBE. These factors combined to prop up that state's average gasoline price to 45-50¢/gal higher than the national average at the beginning of the summer driving season, said EIA in its June Short Term Energy Outlook.
OGJ forecasts that residential heating oil prices will average $1.30/gal this year, up from $1.13/gal last year. Low stocks combined with colder weather drove up the US average price of residential heating oil to $1.51/gal in February, whereas the winter of 2002 was milder, and stocks were higher than usual then.
Natural gas prices
Low inventories during and following the US winter heating season have driven up gas prices. Production and import declines came at the same time as the cold hit, escalating supply fears.
The futures price of gas on the NYMEX hit a 2003 high of $9.577/MMbtu on Feb. 25 for the March delivery contract. The March contract closed the following day at $9.133/MMbtu.
Since then prices have moderated but are not expected to reach the previously normal range of $1.50-2.50/MMbtu. The average price of gas on the NYMEX from 1990 through 1999 was $2.03/MMbtu.
The NYMEX gas contract closed at $5.146/MMbtu for April delivery and $5.123/MMbtu for May delivery. Then, in anticipation of the summer cooling season, gas futures bounced back up to close out the June contract at $5.945/MMbtu. The July contract closed on June 26 at $5.291/MMbtu.
The US wellhead gas price averaged $4.47/MMcf in January, up from $2.35/MMcf a year earlier. More recent monthly figures were not available at press time, but OGJ forecasts that for 2003, the wellhead price will average $5/MMcf.
US economy
OGJ's US energy forecast is based on the assumption that real gross domestic product (GDP) will increase 2% this year. GDP increased 2.4% last year and 0.3% in 2001. This year will be the 12th consecutive year of economic growth, following a short recession that started in late 1990.
New York-based research group the Conference Board reported that its Index of Leading Economic Indicators rose 1% in May, the largest increase since December 2001. The index, which aims to predict the economy's direction in the next 6-9 months, moved up slightly in April.
"This increase was largely due to stock prices, real money supply, and consumer expectations, but most other components also increased slightly. It is possible that these two consecutive increases reflect the beginning of an upward trend, thereby ending the flat trend that began in early 2002," the Conference Board reported.
First quarter 2003 GDP grew at an annual rate of 1.4%. OGJ expects growth to pick up momentum in the second half of the year based on several factors, including rising stock prices. Additionally, the falling dollar should help increase US exports, interest rates are keeping borrowing costs down, and the housing market continues to show remarkable strength.
The Federal Reserve reported that industrial production edged up 0.1% in May after falling 0.6% in both March and April. This latest figure remains below the May 2002 level, however. Capacity utilization for total industry, the Fed reported, was unchanged from April at 74.3%, a rate seven percentage points below its 1972-2002 average.
The Federal Open Market Committee (FOMC) decided late last month to lower the federal funds rate for the first time since Nov. 6, 2002, to 1% from 1-1/4%. This is the lowest that the rate has been in 45 years. Driving this adjustment was the fact that the economy had yet to exhibit sustainable growth. Also, the probability of a substantial fall in inflation exceeded the probability of a pickup in inflation from its already low level, the FOMC said.
The latest available data show that the unemployment rate has failed to level off yet. The most recent statistics released by the Department of Labor's Bureau of Labor Statistics indicate that unemployment in May rose to 6.1% from 6% in April and 5.8% in March. This is the highest rate since July 1994.
US energy demand
The small boost in the economy will mean that the US will demand more energy this year. More energy will be required for transportation and electric power generation. OGJ forecasts that total energy demand will be 100 quadrillion BTU (quads), increasing at the same annual rate as GDP.
Energy consumption increased in 2000 to 99 quads from 96.8 quads, then declined to 96.4 quads in 2001. Last year total US energy consumption partially rebounded to 98.1 quads.
Energy efficiency, measured as the amount of energy consumed per dollar of GDP, will be unchanged from last year at 10,390/$1. This ratio has improved each year since 1970, when the energy efficiency ratio was 19,800/$1.
Energy by source
US energy demand will increase in 2003 for all sources except gas. Oil will continue to dominate the energy market, while coal consumption creeps up to nearly the same level as gas (Table 8).
Oil energy consumption will increase 2.8% this year following a 0.4% decline last year. With demand at 39.25 quads, petroleum's share of the energy market will be 39.2%, up from 38.9%.
Meanwhile, gas energy consumption will be unchanged from a year ago as consumers switch to less costly fuels where it is possible. Gas faces competition in the electric utility sector from coal, nuclear, and hydroelectric power. Demand for coal, mainly for power generation, will increase 3.7% to 23 quads, so gas will lose market share as coal consumption rises.
The use of coal has been rising along with electric power consumption, but demand growth for this fuel continues to be restrained by environmental concerns and related costs of clean air regulations.
The combined market share for oil and gas this year will be 63%, down from 63.2%. Coal will comprise 23% of the total energy market vs. 22.6% a year ago.
Energy from nuclear power will be nearly the same as last year at 8.15 quads. The number of operable units in the US stands at 104, the same since 1998. The number of operating nuclear units peaked in 1990 at 112, although capacity peaked in 1996 when 109 units were operating.
Still, the amount of electricity generated by nuclear units has been on the rise. Nuclear electricity net generation was 577 billion kw-hr in 1990, 675 billion kw-hr in 1996, and 780 billion kw-hr last year. In 2002, nuclear's share of total US electricity net generation was 20.3%. Capacity utilization last year was 90.4%.
Consumption of energy from hydroelectric power and all remaining sources will be little changed from last year at 5.8 quads. This category includes wood, waste, alcohol fuels, geothermal, solar, and wind power.
Hydroelectric power demand was 2.66 quads last year and is on pace to be about the same this year, according to the most recent statistics. In 2001, hydro supplied 2.2 quads of energy, down from 2.8 the previous year because of unusually dry weather in the Northwest. Drier-than-normal weather has prevailed for several years, as hydroelectric power use exceeded 3 quads in the late 1990s.
Natural gas market
Natural gas demand in the US got a boost at the beginning of this year when cold winter weather took hold. But OGJ forecasts that for the year, gas consumption will be unchanged from 2002 as high prices erode demand, most noticeably in the industrial sector.
The amount of gas in storage has been the focus of the market so far this year, as storage levels have stayed below the 5-year average range since March. At the end of February the amount of working gas in storage was 974 bcf. That was 53% lower than a year earlier, when stocks were at the top of their 5-year average.
For the 2002-2003 heating season, gas storage levels shrank an estimated 2.5 tcf. This compares with a draw of 1.6 tcf for the same period a year earlier and 2 tcf for the 2000-2001 heating season.
The normal average number of gas home heating degree-days for November through March is 3,860. For the 2002-2003 heating season, the number of heating degree-days was 3,709, up from 3,264 a year earlier.
The amount of gas delivered to residential consumers in January was 946 bcf, up from 821 bcf in January of last year and down from 977 bcf during the same month in 2001.
For the week ended June 20, the latest data available at press time, stocks of working gas increased to 1,550 bcf; this is 500 bcf below the 5-year historical range.
Stocks should be sufficient heading into the next heating season, as one factor that will ease supply pressures is waning industrial demand, which is more price-sensitive than residential or commercial demand. Total industrial gas consumption last year declined to 7.12 bcf from 7.36 bcf in 2001 and 8.14 bcf in 2000.
Meanwhile, the amount of gas supplied to electric power providers has been climbing, as most new generators are gas-fired combined cycle units. Total gas supplied to these consumers was 5.55 bcf last year vs. 5.34 bcf last year and 5.21 bcf a year earlier. Electric power providers consumed 4.82 bcf of gas in 1999, up from 4.59 bcf in 1998 and 4.07 bcf in 1997.
OGJ forecasts that production of gas in the US will increase this year to 20.2 bcf, a gain of 1.2% from last year. Deepwater production gains will offset high depletion rates on the Gulf of Mexico shelf, although the National Oceanic and Atmospheric Administration outlook indicates a 55% probability of an above-normal Atlantic hurricane season in 2003. The outlook calls for 11-15 tropical storms with 6-9 becoming hurricanes and 2-4 becoming major hurricanes. Any of this activity could reduce output from the GOM, as it did last September and October.
Additional gas production from Wyoming via the Kern River pipeline has come on stream this year. The once-idle production units there are now able to supply western markets after pipeline expansions have been completed, more than doubling capacity of the pipeline system.
Additional production is expected to come online from new wells in the Bossier trend of East Texas and North Louisiana and from drilling in the Barnett shale of North Texas. For the week ended June 27, the Baker Hughes Inc. count of active rotary rigs showed that 86% of all rigs in the US were being used to drill for gas, and only 11% of those were located in the GOM.
Imports of liquefied natural gas (LNG) will be up this year. So far, the data indicate that imports from Trinidad and Tobago have increased, and OGJ projects that in total the US will import 300 bcf of LNG in 2003. Imports of gas from Canada and Mexico will be slightly lower.
US petroleum demand
This year's high gas prices are causing quite a bit of fuel switching to oils. Total demand for petroleum products in the US this year will be 20.22 million b/d, up from 19.66 million b/d last year.
Motor gasoline demand will remain strong, and residual fuel oil consumption will surge. Jet fuel demand will continue to sag. The use of LPG and ethane will decline, and exports will be nearly unchanged from a year ago.
US consumption and exports of crude and products will total 21.2 million b/d, up from 20.64 million b/d.
Jet fuel
Jet fuel demand will drop 2.8% this year as air travel remains suppressed in the ailing economy. Most airlines have continued to consolidate flight schedules. Air travel declined during the first half of the year in the wake of SARS and the war in Iraq.
According to EIA estimates, jet fuel demand for the first 4 months of this year trailed that for the same period last year by 44,000 b/d. OGJ projects that jet fuel demand will average 1.57 million b/d this year.
Following a steady build, demand for jet fuel peaked in 2000 at 1.725 million b/d then fell to 1.656 million b/d the next year following the Sept. 11, 2001, terrorist attacks.
Motor gasoline
US demand for motor gasoline will increase nearly 3% this year to 9.1 million b/d. The average price of gasoline during the first half of 2003 was about 30¢ higher than for the same period last year.
In a struggling economy, this will hold demand in check. Drivers are taking fewer and shorter trips this summer, also. But the gain in demand will come as many travelers remain reluctant to fly and choose to travel by automobile rather than airplane.
Residual fuel oil
Demand for residual fuel oil will move up 22% because of fuel switching. High gas prices are leading industrial consumers and utilities to switch their fuel to resid from gas when it is feasible. Resid consumption is forecast at 800,000 b/d this year.
Resid demand peaked in 1977 at 3.1 million b/d. A reduction in demand by the electric utility and industrial sectors caused a sharp drop in demand in the years since then as nuclear power output increased, as did price competition from coal and gas.
Distillate
Increased use for industrial production and transportation will boost consumption of distillate this year. Like that for resid, demand for distillate will gain because it is now cheaper than gas.
Distillate demand peaked in 2001 at 3.85 million b/d then declined with the overall economy to 3.77 million b/d last year. OGJ forecasts that distillate demand will rebound to 4 million b/d this year.
At the beginning of the year, demand for distillate as home heating oil soared over last year's levels when cold winter weather took hold. EIA reported that February's demand for distillate totaled 4.4 million b/d, up from 3.7 million b/d during the same month last year.
LPG, other products
US demand for liquid petroleum gas (LPG) and ethane will decline to 2.1 million b/d this year. The decline is based on reduced consumption of the fuel by petrochemical plants, as some petrochemical companies move operations out of the US due to weak market conditions (OGJ Online, June 16, 2003).
Demand for all other petroleum products will be nearly unchanged at 2.65 million b/d. While use of these products, such as asphalt and lubricants, will get a small boost from US economic recovery, a decline in petrochemical production will temper demand growth.
US petroleum supply
Total US liquids production will decline 4% this year to 7.8 million b/d following a slight increase last year. Crude and condensate output will be little changed, but production of NGL will fall 13.5%.
US crude and condensate production has been stagnant over the past few years. Output in 2003 will average 5.8 million b/d vs. 5.824 million b/d last year. In 2001, average production was 5.801 million b/d, down from 5.822 million b/d the previous year.
Alaskan production of crude and condensate slipped each year since 1991—until last year. Alaskan field production averaged 984,000 b/d last year, up from 963,000 b/d a year earlier. Estimates through April show this year's average production lagging last year's, however.
ConocoPhillips Alaska and Anadarko Petroleum Corp. have reported plans to increase the oil production capacity of Alpine field on Alaska's North Slope by 5,000 b/d beginning in late 2004. Alpine field currently produces 100,000 b/d of oil.
US production of NGL will decline to 2 million b/d from 2.3 million b/d last year. As was the case in early 2001, strong gas prices are making it uneconomical to extract the liquids from the gas stream.
For the first 4 months of 2003, EIA data show that NGL production has declined to average 1.765 million b/d compared to 1.886 million b/d for the same period of last year and 1.697 million b/d a year earlier.
Imports
To help satisfy demand, total US industry petroleum imports will increase this year. Excluding imports of crude for the Strategic Petroleum Reserve, imports of crude and products will average 12 million b/d. This is a 6% increase from last year.
Crude will comprise 9.5 million b/d of imports compared to 9 million b/d last year. Crude imports peaked at 9.3 million b/d in 2001, having risen steadily since 1991.
The US imported most of its crude from Saudi Arabia last year. At 1.52 million b/d, Saudi Arabian imports were followed by imports from Mexico of 1.49 million b/d, crude imports from Canada of 1.43 million b/d, and crude imports from Venezuela of 1.2 million b/d.
OGJ forecasts that buoyed by strong demand for gasoline and distillate, product imports will also increase this year to 2.5 million b/d from 2.3 million b/d. For the first 4 months of 2003 product imports led those of the same period last year by an average 295,000 b/d.
Last year, the source of the most product imports was Canada, which exported 513,000 b/d to the US. Following Canada were Algeria, the US Virgin Islands, and Venezuela.
Total imports supplied 58% of the US petroleum market last year. OGJ expects this year's total import dependency to be 59%.
Imports of crude for the SPR last year averaged 16,000 b/d, up from 11,000 b/d a year earlier. Through April, no crude had been imported for the SPR this year.
Stocks
SPR stocks stood at 599.1 million bbl at the end of 2002, up from 550 million bbl at the end of the previous year. At the end of June, SPR stocks had moved up a bit more to 606 million b/d. The SPR continues to be replenished following a fourth quarter 2000 draw that reduced inventories to 541 million bbl.
Industry stocks of crude oil ended 2002 at 277.7 million bbl, their lowest end-of-year level since 1975. Crude stocks have increased a bit since then, ending the first half of this year at 280 million bbl. OGJ expects that crude inventories will end this year at 270 million bbl.
Product inventories have trended lower than usual as well. Product stocks declined 136,000 b/d last year. Motor gasoline inventories ended June at 208 million bbl, down from 218 million bbl a year earlier. Distillate stocks were 110 million bbl at the end of June, down from 130 million bbl a year earlier.
OGJ expects that product stocks will stand at 650 million bbl at the end of this year, down from 674 million bbl at the end of 2002. SPR stocks are forecast to build to 650 million bbl by yearend.
Refining
Despite high utilization rates, low product stocks—especially of gasoline and distillate—sustained healthy refining margins early this year.
Refining utilization rates during May reached levels not seen in 2 years, reported API. At 95.3%, the May utilization rate was nearly four percentage points higher than a year earlier. API cites the distillate market as the driver in this increase, as gasoline output has declined 2% over the first 5 months of the year. Capacity utilization will be just under 92% for the year, according to OGJ projections.
The refining margin for US Gulf Coast refiners processing West Texas Sour was $10.10/bbl in February, according to Pace Consultants Inc. Margins have moderated somewhat since then but remain above year-ago levels. The March margin was $8.21/bbl, and the April margin was $5.80/bbl.
The cash operating margin for Gulf Coast refiners, according to Muse, Stancil & Co., was $2.55/bbl in May, down from $4.13/bbl in April.
The average refiners' acquisition cost of crude during the first 4 months of this year was $30.36/bbl compared to $20.49/bbl for the same period last year. OGJ forecasts that for all of 2003, the refiners' acquisition cost of crude will average $28/bbl.
