Authors' note: The research described in this article was conducted by the authors while still employed at RAND Science & Technology, for the US Department of Energy's National Energy Technology Laboratory under contract with Concurrent Technologies Corp., Contract No. 500402.
In the course of considering long-term technology development directions for research and development in fuels and electric power generation, we examined predictions of long-term worldwide energy resource availability, with a focus on oil, natural gas, and coal.
This articles discusses the difficulties identified in determining, with any degree of accuracy, how long energy resources will last or estimating the year worldwide production will peak.
In a practical sense, it is clear that worldwide energy resources are finite. However, saying much more than that they are finite is very difficult. Our inability to define how long an energy resource will last or to identify the year of peak production results from two shortcomings.
First, we cannot measure the precise size of the resource. Many people have tried, using a multitude of techniques, but the one constant in all of these efforts is that the earlier estimates have proven to be too conservative and have been revised upward over time.
Second, we cannot predict, with any degree of accuracy, how much of the in-place resource will actually be produced. Our ability to produce a resource is impacted by many factors. One of the most important is the pace and type of technological improvement. Again, many have tried to predict production peaks or totals, but most allow themselves wiggle room by tying those estimates to "today's technology" or "foreseeable" energy prices.
Changing perspective
Nonetheless, there has been a fundamental change in the perspective regarding energy resources over the last few decades. Starting with the forecasts of M. King Hubbert,1 continuing with the much-maligned 1972 Club of Rome report, "Limits to Growth,"2 and, more recently, with the predictions of an impending peak in world oil production by Colin Campbell and Jean Laherrère,3 the recognition of resource limits has gained greater credence, and the time horizon when those limits might begin to impact energy prices and supplies has shortened to a matter of decades. Dissenters tend to debate the date when production will begin to trend down and not whether or not the resource is finite.
Given this evolving perspective, planning for a transition from traditional fuels to alternatives (including more-exotic oil and natural gas resources) or how to extend the life of the remaining conventional energy resources has increased in importance.
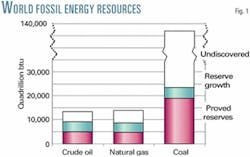
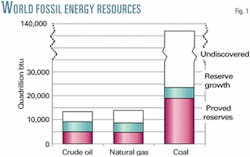
Based on existing resource estimates, world fossil energy resources appear to be extensive (Fig. 1). Our interest here is in the technically recoverable resource, not the resource in place. For example, only about 50% of the in-place crude oil resource is considered to be technically recoverable (there is some debate about this, which will be discussed later).
Considering only proved reserves, conventional reserve growth, and undiscovered conventional resources, the total worldwide remaining crude oil resource is estimated to equal over 13,400 quadrillion btu (quads), and the remaining natural gas resource totals over 14,000 quads. This compares with worldwide crude oil production of 139 quads and natural gas production of 87 quads in 1999.
The conventional crude oil resource excludes unconventional oils such as bitumen, extra-heavy oil, and shale oil. Examples of these resources would include the Orinoco oil belt in eastern Venezuela, the oil sands in Alberta, and oil shale in the US Rocky Mountain states. There is currently relatively little production from these resources, owing to their high cost or technological limitations. However, unconventional oil resources are very large, and production and investment in them is growing rapidly. The resource categories for unconventional oils are defined a little differently than those for crude oil or natural gas, but the categories are similar in practice. If we include proved reserves and estimated additional resources in place (amounts in unexplored areas or undiscovered), total worldwide bitumen, extra-heavy oil, and shale oil resources are estimated to equal at least 15,000 quads. This is roughly equal in size to the total conventional oil resource. These numbers may be conservative, because exploration has historically focused on conventional oils.
As discussed here, the natural gas resource does not include consideration of more-exotic resources, such as geopressured brines or gas hydrates. Given current and anticipated technology, these resources are far from being economically recoverable, although they hold considerable promise. The US Lower 48 in-place geopressured-brine resource has been estimated to be as large as 24,000 tcf, and the gas hydrates resource has been estimated to be 300,000 tcf (25,000 and 310,000 quads, respectively)6. Clearly, on a worldwide basis, the resource could be much larger.
Crude oil, natural gas, and unconventional oil resources are dwarfed in size by the coal resource. Including proved amounts in place (proved reserves plus additional amounts assessed as exploitable) and estimated additional amounts in place (amounts in unexplored areas or undiscovered), total worldwide coal resources equal over 135,000 quads. Worldwide coal production in 1999 was 100 quads.
Resource recovery
The probability of actually recovering each element of the remaining resource declines as we move from proved reserves to undiscovered. Proved reserves are the most certain of the resource categories. Proved reserves are the equivalent of an inventory of goods available for sale at a manufacturing company. Much of the oil and natural gas resources lie in the less-certain conventional reserve growth and undiscovered categories. These resources must be developed into deliverable resources before they can be included in the proved reserves category. This development is the equivalent of the manufacturing process. Therefore, to be conservative when evaluating resources, many analysts focus on proved reserves.
Based only on proved reserves, there are about 5,200 quads of crude oil. At 1999 levels of production, this implies a conventional crude oil resource life of 37 years. Even if the unconventional oil reserves (roughly 600 quads) are added, the oil resource life extends only to 42 years. By comparison, natural gas proved reserves equal 4,900 quads. At 1999 production levels, this implies a resource life of 57 years. Even the relative life of the coal resource shrinks significantly if we only consider proved reserves. With 18,900 quads of proved coal reserves, 1999 levels of production imply a resource life of 229 years. While using proved reserve data places a more near-term limit on the life of the resources, it still implies an extended period of continued production.
Resource depletion
However, dividing proved reserves by current production does not provide a valid measure of the viability of an energy resource.
First, it assumes that production will remain constant at the current level.
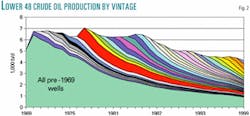
Second, it assumes that the last barrel of oil, Mcf of gas, or ton of coal can be produced as quickly in the future as it is currently. This thinking ignores the concept of resource depletion. With depletion, the rate of production from any field or mine rises to a maximum (usually in the first few years of production) and then gradually falls toward zero, at which point the particular field or mine is abandoned. Abandonment may, in fact, occur well before production falls to zero. At some point, prior to the physical exhaustion of the resource, the level of production may be too small to cover the cost of continued operation and the well or mine will be abandoned. Fig. 2 provides actual data for oil production by vintage for the Lower 48.7 The figure illustrates that depletion as production from each vintage of wells declines over time.
Third, energy consumption is growing. Oil consumption grew at an average annual rate of 1% from 1980 to 1999. Gas consumption grew by 2.5%/year and coal by 0.7%/year, respectively, over the same period. If demand continues to grow in the future, annual production of oil, natural gas, and coal must also grow.
As noted by Campbell and Laherrère: "From an economic perspective, when the world runs completely out of oil isUnot directly relevant; what matters is when production begins to taper off. Beyond that point, prices will rise unless demand declines commensurately."
While an individual well or mine will deplete over time, as long as new resources are brought into production at an equal or faster rate, total production can be held constant or increased. That has been the trend since the beginning of the 20th Century. However, at some point with continued exploration and production, the number and size of new fields discovered will begin to decline, and it will become increasingly more difficult to offset the effects of depletion. At some later point, total production will peak and then begin to decline.
Hubbert curve
A technique developed by Hubbert proposed a method for predicting when the downturn in oil production will begin. Hubbert hypothesized that the pattern of production should fit a symmetrical, bell-shaped curve. He had observed this pattern for a number of commodities and hypothesized that it was likely applicable to crude oil as well. In this model, production peaks when roughly one half of the resource has been produced.
Hubbert's theory depends on three key factors. First, the in-place resource can be estimated accurately. Second, the percentage of the in-place resource that ultimately will be recovered can be defined. Third, production cannot be accelerated through the application of technology (extending the year of peak production), thereby creating an asymmetrical curve.
In recent years, Hubbert's technique has been applied by a number of practioneers. One notable application is the crude oil production curves developed by Campbell and Laherrere that project a world crude oil production peak in 2004. Campbell and Laherrère's prediction relies on their own estimate that ultimate recovery will be about 1.8 trillion bbl of crude oil (out of an in-place resource of 6 trillion bbl).
In a publication, "Long-Term World Oil Supply,"8 DOE's Energy Information Administration developed an estimate of the production peak that relies on the most recent US Geological Survey estimate of the world crude oil resource (ultimate recovery of about 3 trillion bbl). Besides using a larger ultimate resource, EIA considered various production growth rates of 0-3.0%/ year. Based on these assumptions, EIA estimated that world crude oil production would peak sometime between 2030 and 2075.
While we can agree that energy resources are ultimately finite, the point at which production peaks (whether discussing oil, gas, or coal) and begins to turn down is of great importance, because that is the point at which prices will escalate due to resource limitations, as opposed to normal market fluctuations. The estimates of peak production are not universally accepted, and they are subject to substantial uncertainty.
Resource endowment
A key variable in the predictions of the production peak is the estimated size of the ultimately recoverable resource. A larger resource base leads to a later production peak. As noted earlier, estimates of the size of the world oil resource have trended upward over time, from 600 billion bbl in the early 1940s to over 3 trillion bbl today. This trend has also been true for natural gas and coal.
There are two basic reasons for this trend.
First, the lion's share of energy exploration and development activity has taken place in the US. Much of the world remains unexplored or underdeveloped for a variety of reasons.
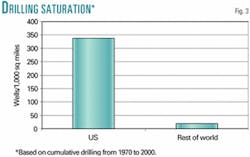
Roughly two thirds of all of the oil and gas wells ever drilled have been in the US. It is only in the last 10 years that the split in drilling activity between the US and the rest of the world has evened out.9 10 There are 3.7 million sq miles of surface area in the US, almost 52 million sq miles in the rest of the world, and 138 million sq miles under oceans. When compared with drilling activity in the US, relative drilling in the rest of the world has been modest. Over the period from 1970 to 2000, there were almost 18 times more wells drilled in the US per 1,000 sq miles when compared with the rest of the world (Fig. 3).
Second, we've learned a great deal about the various energy resources as they've been developed, both from the basic experience of exploration and production (learning by doing) and from advances in technology.11 A good example of the impact of technology is provided by looking at its effect on our estimates of the size of the technically recoverable oil and gas resources. In the last decade there has been a dramatic expansion of new technologies applied to oil and gas exploration and production (e.g., horizontal and directional drilling, flexible pipe, downhole technology, shipboard drilling and production, 3D and 4D seismic, etc.). These new technologies have reduced the cost of exploration and production, increased recovery factors, and improved drilling success rates. As a result, oil and gas producers are able to produce resources that were previously considered uneconomic and reach resources in remote areas or beneath difficult terrains that previously could not be accessed. From the perspective of the resource base, these developments have expanded the portion of the in-place resource that will be economically viable and increased the percentage of the in-place resource that ultimately can be recovered.
Technology role in recovery factor debate
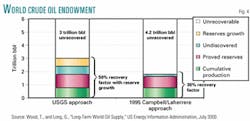
One of the key differences between the estimates of the production peak by EIA and Campbell-Laherrère is their assumptions about how much of the in-place crude oil resource is recoverable (Fig. 4). Both assume that the in-place crude oil resource is roughly 6 trillion bbl. However, the USGS resource estimate used by EIA assumes that 50% of the in-place resource will ultimately be recovered, while Campbell and Laherrere assume that only 30% of the resource will be recovered. Much of this difference can be attributed to their assumptions about the impact of technology.
Technology improvement takes many forms. One example is the oil and gas exploration and production industry's ability to drill in progressively deeper waters (Fig. 5). From the start of offshore drilling in 1938, it took 40 years before the industry had the ability to drill at water depths of 1,000 ft. It took an additional 15 years before the industry could drill at water depths of 2,000 ft. Developing the capability to drill at each incremental 1,000-ft interval took progressively less time. The E&P industry was drilling at 3,000 ft 4 years later, 4,000 ft 2 years after that, and, jumping right over 5,000 ft and 6,000 ft, demonstrated the capability to drill at 7,000 ft only a few months later with the completion of the Atwater discovery well in the Gulf of Mexico. More recently the industry completed the Chinook discovery well, also in the Gulf of Mexico, at a water depth of over 8,000 ft. Each 1,000-ft increment generally was reached in progressively less time and at less cost per foot. In fact, the total cost of some recent platforms is less that that of earlier platforms despite deeper water and more-hostile environments. How much further this capability can be expanded is, of course, not easily predictable.
The improved capability to drill at greater water depths allows oil and gas producers to produce resources that were previously uneconomic and inaccessible. This improving capability increases the portion of the in-place resource that is ultimately recoverable. Fig. 6 highlights the growth in the potential exploration area if we move from only drilling onshore, to drilling at water depths of up to 6,500 ft (about the capability in 1997), and, finally, if we include water depths up to 9,840 ft.4 This is a little deeper than current capability, but not a great stretch. At this depth, the potential area for worldwide exploration is expanded significantly. The point is that technology is not static. This is the primary flaw in the original Hubbert and recent Campbell-Laherrère models. It is the primary reason why Campbell's prediction of the worldwide peak production year has gradually been revised from his initial prediction of 1989 to the current 2004.12
Our analysis casts doubts on the dire resource projections made by Campbell-Laherrère and others. It also highlights shortcomings in the meth- odology originally developed by Hubbert. However, it does not refute the argument that traditional energy resources, such as oil, natural gas, and coal, are ultimately finite. The debate is between those who argue that resource will begin to peak in the very near term and those who see the potential for continually higher production levels for the next 50-100 years, making resources infinite from the perspective of this generation.
Our analysis also calls into question some of the more dire predictions about when these finite resources will bind, resulting in a decline in annual production. As noted by Henry Linden in an article published in Oil & Gas Journal in 1998, which also questioned the Campbell-Leherrère projections, stating that this "Ushould not be used as an argument against aggressive investments in technologies that accelerate the progress towards a sustainable global energy system. Instead, we should take advantage of this valuable lead time to accelerate the development and deployment of cost-effective low and zero carbon-emission energy technologies."13
References
- Hubbert, M.K., "Techniques Of Prediction As Applied To The Production Of Oil And Gas," in Glass, S.I., ed., Oil And Gas Supply Modeling, National Bureau of Standards, Special Publication 631, pp. 16-141.
- Meadows, D.H., Meadows, D.L., Randers, J., and Behrens III, W.W., Limits To Growth, Potomac Associates, 1972.
- Campbell, C.J., and Laherrère, J.H., "The End of Cheap Oil," Scientific American, March 1998.
- World Energy Council, 1998 Survey Of Energy Resources, 18th Edition, 1998.
- US Geological Survey, World Petroleum Assessment 2000: Description And Results. DDS-60, Version 1, 2000.
- National Petroleum Council, Natural Gas: Meeting The Challenges Of The Nation's Growing Natural Gas Demand, Volume II, December 1999.
- Potential Gas Agency, Potential Supply of Natural Gas in the United States, Colorado School of Mines, March 2001.
- Wood, J., and Long, G., Long-Term World Oil Supply, US Energy Information Administration. http:// www.eia.doe.gov/pub/oil_gas/ petroleum/presentation/2000/long _term_supply/index.htm, July 28, 2000.
- WorldOil.com, "Pendulum Finally Swings To Positive," http:// www.worldoil.com/magazine/magazine_detail.asp?ART_ID=155, February 2000.
- WorldOil.com, "High Prices Breed Surge In Activity," http:// www.worldoil.com/magazine/magazine_detail.asp?ART_ID=1409, February 2001.
- Fisher, W.L., "How Technology Has Confounded US Gas Resource Estimators," OGJ, Oct. 24, 1994, p. 100).
- Lynch, M.C., "Closed Coffin: Ending The Debate On 'The End Of Cheap Oil,' Unpublished paper, September 2001.
- Linden, H.R., "Flaws Seen In Resource Models Behind Crisis Forecasts For Oil Supply, Price," OGJ, Dec. 28, 1998, p. 33.
The authors
Paul Holtberg last year was named director, demand and integration division, at the US Department of Energy in Washington, DC. Previously, he was a senior policy analyst at RAND Corp. in Arlington, Va., joining RAND in June 2001. Prior to that, Holtberg spent almost 20 years at the Gas Research Institute. He participated in both the 1992 and 2000 National Petroleum Council natural gas studies, was a member of the American Gas Association Gas Supply & Demand Committee, and was a regular participant in the Stanford University Energy Modeling Forum, EIA National Energy Modeling System review panel, as well as other industry groups and panels. He is a member of the American Economic Association and International Association for Energy Economics as well as other professional organizations in the field of energy and has also taught and worked as a consultant. Holtberg received a BA in economics from the State University of New York at Binghamton in 1976, an MA in economics from Rutgers University in 1979, and an MBA in finance from George Washington University in 1990.
Robert L. Hirsch is a senior energy program advisor at Science Applications International Corp., San Diego, and a consultant in energy, technology, and management. Previously, he was a senior staff member at RAND, where he did energy policy analysis. Prior to that, he was executive advisor at Advanced Power Technologies Inc., where he developed and evaluated start-up business opportunities and provided programmatic support to DOE's Environmental Management Program. Other experience includes stints as a vice-president with Electric Power Research Institute, vice-president and manager of upstream research and technical services for Atlantic Richfield Co., manager of Exxon Corp.'s synthetic fuels research laboratory, manager of petroleum exploratory research at Exxon, and positions with the US Energy Research and Development Administration and US Atomic Energy Commission. Hirsch is immediate past chairman of the Board on Energy and Environmental Systems of the National Research Council and is a National Associate of the National Academies. He has a BS in mechanical engineering from the University of Illinois, an MS in nuclear engineering from the University of Michigan, and a PhD in engineering-physics from the University of Illinois.
