Forecasts of the imminent depletion of oil are as old as the industry itself, and that has not changed. What has changed is the growing amount of historical oil data now available to test the forecasts.
This article examines three world oil forecasts against a reference database provided by the oil industry itself. Each of the forecasts predicts the year when world oil production will peak and the post-peak production change rate.
If the historical data are consistent with the forecasts, then they are said to support the forecasts. Otherwise they do not support the forecasts.
Three indicators (measures) are used to test the world oil forecasts:
- Oil production acceleration.
- The peaking rate of the world's oil-producing nations.
- The production change rate.
To facilitate comparison, all oil production data and forecasts are normalized to their respective peak rates of production.
Most people agree that the peak of world oil production is an important concern. However, the postpeak production change rate—either gradual or steep—is equally important because it will determine the time available for transition to a new energy regime.
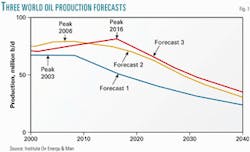
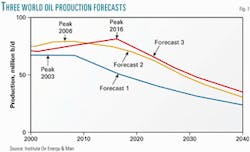
Forecast 1 is from Campbell,1 Forecast 2 is from Duncan and Monnin,2 and Forecast 3 is from Smith and Douglas-Westwood.3 4 Fig. 1 compares the three forecasts of world oil production from 2000 to 2040.
Forecast 1
Most countries are now past midpoint of their production potential (or close to it), except the US, which is far past it and the five Middle East countries that are far from it.
The producing countries of the world can be divided into those past midpoint, where production is set to continue to decline, and those that have not yet reached it, where production can still increase.
We may further consider the five Middle East countries as an extreme category of the premidpoint group, because their "yet-to-produce" is large and their depletion rate low. They can behave as swing producers, making up the difference between world demand and what the other countries can produce.
The base case scenario indicates that production rises at a conservative 2%/ year until the swing producers control 30% of the world market, which would have occurred in 1998 under this model. Prices then increase by a factor of two or three, which curbs demand, giving a plateau of production at 67 million b/d until 2008.
It is expected to end when the swing share has risen to about 50%. Production will then start to decline at the then world depletion rate.1
Forecast 2
Separate models were built for the world's top 44 oil-producing nations. The national forecasts were then combined to give the world oil forecast.
World oil production from 1960 to 1973 increased by 167%—an average growth rate of 7.0%/year during 13 years. Thereafter, production from 1973 to 2000 increased by 29%—an average growth rate of 1.5%/year during 17 years.
The world's cumulative oil production, Q, is now in a transition from exponential growth to asymptotic growth. The shape of this curve is called "S-shaped growth." Its shape is caused by the variations in world oil acceleration, the first derivative of oil production with respect to time.
World oil production acceleration equaled 0.4 billion bbl/year in 1960, increased to 1.9 billion bbl/year in 1973, then decreased to 0.9 billion bbl/year in 2000. In other words, world oil acceleration grew by a remarkable average rate of 7.6%/year from 1960 to 1973, but then it slowed to a moderate 2.5%/year from 1973 to 2000.
Of the 44 nations we modeled, 15 nations are 5 years or more past their peak rates of production. We believe that 9 additional nations are also postpeak. Thus, 55% (24/44) of the nations are assessed to be postpeak.2
Forecast 3
While there are lots of new fields waiting to be found, especially offshore, there is scant chance of finding more than a few dozen substantial accumulations. In fact, 60% of the world's oil is located in just a few giant fields found before 1970. Without many more giants, it is impossible to add substantial oil reserves.
We now actually discover only around 10 billion bbl each year, but last year we produced over 26 billion bbl.
There are now 56 countries where production is in decline, and all but a few special exceptions show that the peak year occurred when 40-60% of reserves had been extracted.
It is estimated that, at an annual 1% demand growth, global peak will be reached in 2016. By 2016 or thereabouts, extracting sufficient oil to satisfy a fairly modest 1% global demand growth will be physically impossible, and the eventual shortfalls will lead to competition for supply.3
About 95 countries now produce oil, have produced it in the past, or will produce it in the future. However, 46 countries, including the US and Russia, are already well past peak (greater than 5 years). Another 10, including the UK and Malaysia, are just beginning to see declining production. Twelve countries, including Norway and China, will reach peak soon. The remaining 27 will peak within the next 20 years.4
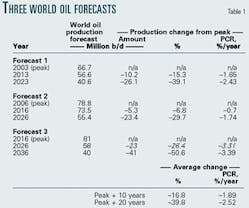
As mentioned, all oil production is normalized to the peak rate of production to facilitate comparison between the data and the forecasts (Table 1). Column 1 of the table shows that the predicted peak years of world oil production are 2003, 2006, and 2016, respectively.
The production change and the production change rates (in percentages) are given for each forecast. A negative production change rate (PCR) indicates a production decline. The average PCR for the three world oil forecasts from peak to peak + 20 years was –2.52%/ year.
The three world oil forecasts taken together predict that world oil production will reach its all-time peak during 2003 and 2016, and the world oil production change rate (PCR) from peak to peak + 20 years will be –2.52%/ year.
The world oil forecasts will be tested later, but first we must establish the historical oil production data for testing them.
The postpeak nations
Our reference database contains the 44 top oil-producing nations of the world, which accounted for 98.6% of the world's production in 2000; it is available free on the internet.5 We focus on the 24 nations that are assessed to be passed their peak rates of production.
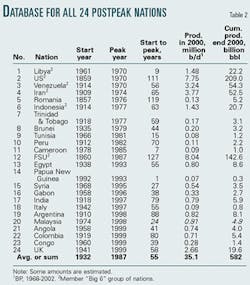
The list of 24 postpeak nations is sorted first by peak year and second by alphabetical order (Table 2). "All 24" means all 24 postpeak nations. The "Big 6" group comprises the six dominant postpeak producers, namely US, former Soviet Union, Venezuela, Iran, Libya, and Indonesia. The "Other 18" group comprises All 24 nations minus the Big 6.
The rate at which the world's oil-producing nations pass their peaks indicates the status (maturity) of world oil production. To that end, the peaking rate is defined as the number of oil-producing nations that peak per decade.
For example, at a time when only one or two nations have peaked, then the world oil production peak is likely to be far in the future. When, say, 30 of the 44 nations have peaked, then the world oil peak is likely to be history.
The peaking rate of the world's top 44 oil-producing nations was zero for 110 years from the 1850s through the 1960s. Then it suddenly jumped to 8 peaks during the 1970s, fell to 4 peaks during the 1980s, and soared to 12 peaks during the 1990s.
The average time from start to peak for the All 24 nations was 55 years. However, the average start-to-peak time for the Big 6 group was 72 years, while that for the Other 18 group was 50 years. Moreover, start-to-peak for individual nations ranged from 1 year for Papua New Guinea to 127 years for the FSU.
World oil production in 2000 was 74.5 million b/d. Of that, All 24 accounted for 35.1 million b/d (47.1%), the Big 6 group accounted for 25.7 million b/d (34.5%), and the Other 18 group for 9.4 million b/d (12.6%). Furthermore, All 24 averaged 1.5 million b/d/nation, the Big 6 group 4.3 million b/d/nation, and the Other 18 group 0.52 b/d/nation.
World cumulative oil production at yearend 2000 totaled 939 billion bbl. Of the world total, All 24 accounted for 582 billion bbl (62.0%), the Big 6 group accounted for 501 billion bbl (53.4%), and the Other 18 group 81 billion bbl (8.6%). On a national basis, All 24 averaged 24.3 billion bbl/nation of cumulative production, the Big 6 group 83.6 billion bbl/nation, and the Other 18 group 4.5 billion bbl/nation.
Clearly, the Big 6 group of postpeak nations dominated the oil production of the Other 18 nations and, as a result, that of the All 24 post peak nations of the world from 1978 to 1998.
Some of the 24 nations now listed as postpeak, however, (Table 2) might reach new and higher peaks in the future. It is likewise true, however, that some of the nations not listed, have already peaked.
For an example of the latter, our list of post peak nations does not include Iraq or Kuwait, even though each reached a high peak in the 1970s, followed by significant production declines since. Another example is Australia, where production appears to have peaked in 2000. Thus, although some shuffling of the postpeak list is expected, the list itself is bound to grow.
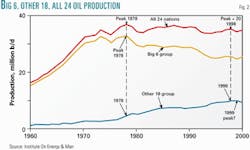
As indicated earlier, the oil production of the All 24 nations equals the sum of the Big 6 group and the Other 18 group (Fig. 2). The 1978 peak and subsequent decline in production of the Big 6 group determined the 1978 peak and subsequent decline in production of All 24 nations, as shown by the fact that the production of the Other 18 group actually increased from 1978 to 1998. (Worthy of note, however, is that the Other 18 group itself may have peaked in 1999, but that is beyond the scope of this study.)
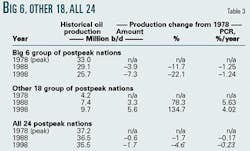
Table 3 shows that oil production by the Other 18 group from 1978 to 1998 increased by 5.6 million b/d, while production by the Big 6 group decreased by 7.3 million b/d. The net result was that oil production of the All 24 nations from 1978 to 1998 decreased by 1.7 million b/d, giving an average postpeak PCR of –0.23%/year.
The oil production history of the All 24 postpeak nations, and other information, serves as the basis for testing the three world oil forecasts.
Other forecast data
The forecasts also take into consideration these data:
Major producers. Two of the world's three leading oil producers are postpeak, namely the US and the FSU.
Organization of Petroleum Exporting Countries. Four of the 11 OPEC nations are postpeak, namely Libya, Venezuela, Iran, and Indonesia.
Oil production per person. World oil production per person peaked in 1979, and then from the 1979 peak to 1999 it fell by 21.5%—an average decline rate of 1.2%/year during 20 years.
This last item is especially relevant because world oil production per capita peaked in 1979 at 5.5 bbl/person/year and then declined in 1999 to 4.3 bbl/person/year. All this happened despite simultaneous advances in oil exploration and production technologies. The peak of world oil production per capita is well documented.6-8
The postpeak world oil PCR for All 24 nations combined was –0.23%/year from 1978 to 1998 (Table 3).
The average postpeak PCR for the three world oil forecasts from 1978 to 1998 was –2.52%/year (Table 1)—nearly 11 times that for the All 24 post- peak nations.
Forecast conclusions
There were three conclusions reached in these studies:
The historic oil production data of All 24 postpeak nations support the three world oil forecasts that predict world oil production will peak during 2003 and 2016.
The postpeak PCR of the All 24 nations combined (i.e., –0.23%/year) does not support the postpeak PCR predicted by the three world oil forecasts (i.e., –2.52%/year).
If the actual world oil postpeak PCR turns out to be on the order of –0.23%/year for several decades, then—with coordination and planning—a manageable transition to a new world energy regime is conceivable.
References
1. Campbell, C.J., The coming oil crisis, Multi-Science Publishing, 1997, pp. 100, 176.
2. Duncan, R.C., and Monnin, B.D., "The world's oil interval: from exponential to asymptotic growth," Sixth in an ongoing series, Institute on Energy & Man, 2001, 31 p.
3. Smith, M.R., "US oil supply vulnerability growing," Offshore, August 2002, pp. 60-64. ogj.pennnet.com/
4. Smith, M.R., et al., "The world oil supply report 2002-2050: the future for world oil supplies, 2002," Douglas-Westwood. www.dw-1.com/
5. BP Statistical Review of World Energy, BP PLC, 1968-2002, An ongoing annual series. www.bp.com/
6. BP-Amoco Statistical Review of World Energy, 2000, p. 11.
7. Duncan, R.C., "The peak of world oil production and the road to the Olduvai Gorge," GSA Summit 2000, Pardee Keynote Symposia, Reno, Nev., Nov. 13, 2000. Published in Population and Environment, May-June 2001, pp. 503-22.
8. Duncan, R.C., "Oil production per capita," (OGJ, May 17, 1999, p. 8).
The author
Richard C. Duncan is director of the Institute on Energy & Man, which he founded in Seattle in 1993. He has worked at the Boeing Co. and Puget Sound Energy Co. in Washington state. From 1985 to 1992, Duncan worked at the Saudi Consolidated Electric Co. in Dhahran, Saudi Arabia. He has also taught engineering at the university level. Duncan received an MS in electrical engineering and a PhD in systems engineering, both from the University of Washington, Seattle.
