Upstream Opportunity Index assesses E&P investments
The year 2000 was a stellar year for the upstream end of the oil and gas industry. Finding and development (F&D) expenditures worldwide reached $40 billion, contributing 6.6 billion boe in additional reserves consisting of 3.9 billion bbl of crude oil and 15.4 tcf of dry natural gas.
The split in F&D outlays was roughly 53:47 between the US ($21 billion) and the rest of the world. Areas that stood out as targets for F&D spending were: Europe ($4 billion), South America ($3.5 billion), the Asia-Pacific region ($3.3 billion), Canada ($3 billion), and Africa ($2.5 billion).
More oil and gas is being discovered by international companies in non-Organization for European Cooperation and Development (OECD) countries. The need to measure project risks and compare similar projects in different countries has become an ever more-complex task for investors. Credit rating agencies have teams of analysts assessing and grading the creditworthiness of the projects and the energy companies involved.
More importantly, the financial institutions that fund these massive investments are demanding that project risk be better understood before financing can be arranged. Ratings also serve other purposes. They determine the interest rate a company pays on its debt and the price at which debt trades.
This article proposes a composite rating index for the upstream industry that strikes a balance between downside (political, fiscal, and environmental) risks and upside rewards or offsets (high potential reserves, low F&D costs, and a solid company financial performance). The intent is to sift the risk and financial data published by industry standard agencies and construct an index—the Upstream Opportunity Index (UOI)—integrating existing proven ratings and rankings indexes for the risk and offset parameters used by financial institutions to establish the investment grade of a project.
Proposed model
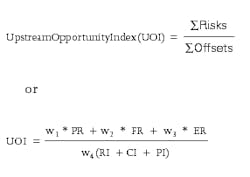
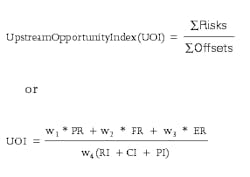
The proposed UOI is a five-tier, unitless grading system with a range of 1-5, where 1 represents investments with the highest overall level of attractiveness and 5, those with the highest risk. It is defined as:
where:
PR is political risk assessed on the basis of an analysis of the political stability and economic and business environment in a country. This analysis incorporates the political risk rating from IHS Energy Group's Petroleum Economics and Policy Solutions (PEPS) database. The overall political risk index in PEPS is composed of four political risk factors (weighted 60%), four socioeconomic risk factors (weighted 20%), and three commercial risk factors (weighted 20%).
FR is fiscal risk, which compares the terms and attractiveness of fiscal regimes for upstream investments offered by selected countries. It is based on several economic criteria as viewed from both a country and investor perspective. This analysis incorporates fiscal risk rankings from the PEPS database. PEPS fiscal risk rankings are derived from eight weighted economic indicators as calculated for a range of hypothetical oil field developments based on a selected fiscal regime for each country.
ER refers to environmental risk. There are essentially two generic indexes of this risk, each with a different perspective. One index assesses risk on the basis of event frequencies and consequences for hazards normally encountered in the oil and gas industry. The other measures the state of the environmental systems (air, water, land, biodiversity) in the country; stresses, such as pollution, on the system; human vulnerability to environmental change; the social and institutional capacity to cope with environmental challenges; and the country's ability to participate in efforts to conserve international environmental resources. This analysis incorporates the latter index, which is referred to as ESI (Environmental Sustainability Index) which was developed by the World Economic Forum.
The variables w1, w2, and w3 are weighting factors, on a scale of 0-1, that reflect the manner in which each risk component historically has affected investments on a global scale. Users generally adjust these factors to fit their own scenarios.
Risks indexes are modeled and published by several prominent agencies such as the Petroleum Intelligence Unit, IHS Energy Group, Euromoney, ESI, Battelle Group, and Peter Carr Consultants Ltd. In general, these entities use different scale values for their rankings. IHS uses a scale of 0-5, where 0 represents the lowest risk.
The ESI index is based on a percentage scale, where 100% represents the lowest risk. The index values of IHS and ESI, used in this article, were converted to the standard 1-5 scale, where 1 represents the lowest risk.
Regarding the offsets in the denominator of our model:
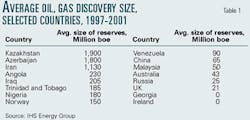
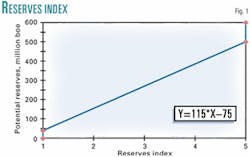
RI is the reserves index, on a scale of 1-5, which indicates the potential reserves (expressed in millions of barrels of crude oil equivalent associated with the country project.) Historical data (Table 1) on the average size of new field discoveries during 1997-2001, were used to establish the following upper and lower limits of this index:
> 500 million boe = 5
where the top end of the scale refers to giant fields defined as those with reserves in excess of 500 million bbl of crude oil or 3 tcf of dry natural gas. Gas is converted to barrels of crude oil equivalent on the basis of 0.178 bbl of oil/1 Mcf of gas. The lower end of the scale corresponds to the quartile limit of the smallest fields discovered during the 5-year period.
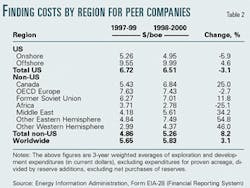
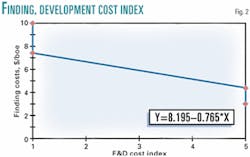
CI is the F&D cost index, which represents regional finding costs (dollars/ boe) measured as a weighted average over a 3-year period in order to accommodate leads and lags in data reporting. These data, published by the Energy Information Administration, shows variations from $2.78/boe for Africa to $9.99/ boe for US offshore, with a worldwide average of $5.83/boe (Table 2). The following upper and lower limits refer to the top and bottom quartiles of the EIA data, for the period 1998-2000:
> $7.43 /boe = 1
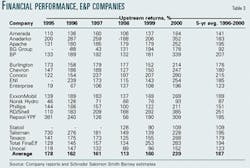
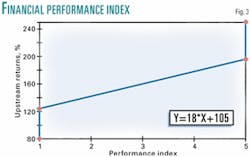
PI is the performance index representing the financial performance of a peer group of 20 integrated and exploration and production companies from Europe and North America. This upstream returns analysis (Table 3), developed by the oil and gas team at Schroder Salomon Smith Barney, combines cost efficiency and profitability for the E&P process and is defined as "cash revenue" as a percentage of "cash cost." A performance of 100% indicates that the revenue from the produced barrels has covered all F&D costs of the added reserves. The following upper and lower limits represent the top and bottom quartiles of the (1996-2000) 5-year average upstream returns in Table 3:
> 195% = 5
and w4 is a weighting factor, on a scale of 0.5-1, that allows users to adjust the degree of the impact of offsets on risks.
Figs. 1, 2, and 3 illustrate the correlation between the reserves, F&D, and financial performance data in Tables 1, 2, and 3, respectively, and the corresponding index values on a scale of 1-5.
For visual effects, the UOI can also be presented on a color scale: green-amber-red. The correspondence to the numerical 1-5 scale is as follows:
Green (<1.60) is the highest rating.
Amber (1.60-2.45) indicates that improvement is needed in the conditions to support investment.
Red (>2.45) indicates that substantial improvement is needed in the conditions necessary to support investment.
This color chart representation allows for a convenient display of the individual risks and offsets indexes in a consistent manner.
Results and Analysis
A broad spectrum of 16 prospective oil and gas producing countries was selected as a sample to evaluate the UOI. IHS Energy's political and fiscal risks indexes and ESI's environmental risk index were used as risks indexes for the test group of countries. Likewise, for consistency, the weighting factors (w1, w2, w3) for the three risks components were each set at a value of 1.
The offset indexes for potential reserves, finding costs, and company financial performance were determined by cross matching the data in Tables 1, 2, and 3 for each country, with the corresponding index scale values in Figs. 1, 2, and 3, respectively.
The weighting factor (w4), which establishes the desired degree of balance between offsets and risks, was set at 0.5. This value was derived from the observation that the spread of the published risks indexes is fairly narrow. For instance, the ESI environmental index varies between 1.5 for the countries with the best record and 3 for those at the bottom end of the 142 countries rated on a scale of 1-5. In contrast, the index values for the offsets cover the entire spectrum of 1-5.
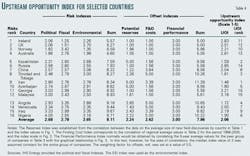
The results of the evaluation are shown in Table 4, which summarizes the risks and offsets indexes used for each of the countries in the sample, and their corresponding calculated UOI. The selected countries originally were ranked 1-16, based on the sum of their three risks indexes. Ireland is rated No.1, with a total risk value of 5.57, while Nigeria occupies position No.16, with a total risk index of 9.71. The maximum sum of the three risks—political, fiscal, and environmental—is 15.
The new UOI rankings of the sample countries perhaps best reflect the impact of the proposed opportunity index. Iran, Kazakhstan, Trinidad and Tobago, and Angola now occupy positions No. 1, No. 2, No. 3, and No. 4, respectively, mainly on the strength of high potential reserves and low F&D costs. They displaced Ireland, the UK, Norway, and Australia, which dropped several notches in their rankings because of low potential reserves and high F&D costs. Ireland's original strength was due to its very favorable fiscal index—the best in the world.
Among the original group of lower-ranking countries, Venezuela, Iraq, and Nigeria made spectacular gains, jumping more than six notches in their rankings. High potential reserves and low F&D costs clearly offset their disadvantages of high political, fiscal, and environmental risks.
Among the other countries in the test sample, Russia dropped eight notches in its rankings because of its low reserves potential and high F&D costs. China dropped only one point; Azerbaijan gained five points; and Georgia and Malaysia dropped five and three notches, respectively, mainly on high F&D costs and low potential reserves. Overall, the role of the offsets indicators, reflected in the opportunity index, was the key in accounting for these subtle, and sometimes major, shifts in the levels of opportunity for investments in the countries sampled.
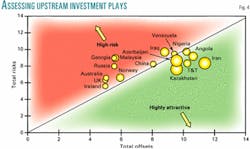
Finally, the chart in Fig. 4 is designed to provide a quick-look, comparative assessment of the investment opportunities in the different countries. Total risks, total offsets, and the reserves index of the country project are graphically displayed in the bubble chart. Typically, the investment required would be proportional to the size of the potential reserves.
Countries with high risks fall in the red zone above the 45° diagonal, while those that are the most attractive plays would lie in the green zone below the diagonal. It should be emphasized that in this graphical solution there is no need for the offsets weighting factor (w4). Its value is therefore set at 1.
Conclusions
The UOI provides a simple but highly effective approach to integrating risk indexes—political, fiscal, and environmental—and diversified offset indicators, such as potential oil and gas reserves associated with the project, country F&D costs, and company financial performance, into a single composite index.
This composite index proved to be a very useful tool for comparing both the relative attractiveness of investments in upstream projects and the attractiveness of the portfolio of a company with E&P activities in several countries. The model has the added advantage of utilizing industry standard indexes and indicators and allows the user to conveniently customize the data to accommodate specific scenarios.
Acknowledgments
My thanks go to Pete Stark of IHS Energy in Denver, to the oil and gas teams of Merrill Lynch and Schroder Salomon Smith Barney in London, and to Rene Peels of ITS, Venezuela, for providing valuable data for this research.
The author
Rafael Sandrea ([email protected]) is president and CEO of ITS Servicios Técnicos, an engineering company he founded 28 years ago to provide services to the oil and gas industry. He holds a PhD in petroleum engineering from Penn State University and has written more than 25 technical publications, including the book Dynamics of Petroleum Reservoirs under Gas Injection, Gulf Publishing, 1974.
