PIPELINE INSPECTION— Conclusion: Reliability-based method assesses corroding oil pipeline
This concluding article of two focuses on application of a reliability-based pipeline condition-assessment methodology to the assessment of an in-service corroded oil pipeline. Part 1, in last week's issue, proposed a probabilistic analysis framework capable of evaluating the current and future integrity of corroding pipelines.
This methodology allows evaluation of the reliability of the pipeline by determining the probability of failure associated with the defects detected and sized by use of high resolution in-line inspection (ILI). Results of this analysis are compared with target reliability levels derived by risk analysis in order to produce operator decision models that reflect the relationship between repairs, corrosion rate, operating pressure, and pipeline's remaining safe life.
These models then permit proposal of strategies to ensure the current and future safe operation of the pipeline based on minimizing the cost of remediation while maintaining, at least, the minimum safety goals projected for the pipeline.
Method development
Pipeline-integrity management is currently undertaken worldwide with reliability and risk analyses in a continuing effort to improve the tools to address integrity and environmental concerns associated with ageing pipelines.1-7 Corrosion is the most prevalent time-dependent safety threat to a pipeline and continues to be the most important cause of failure for oil and gas pipelines in Mexico.5 6
Accordingly, the Pipeline Integrity Assessment Group (GAID) of the National Polytechnic in Mexico through collaboration with Petróleos Mexicanos has made important efforts in developing fitness-for-service methods of analysis, based on deterministic and probabilistic fracture mechanics, to evaluate the integrity condition of ageing corroded pipelines.4-6 8 9
Structural reliability analysis (SRA) has increasingly gained popularity among pipeline operators because of its capability of incorporating results of in-line inspections (ILIs) and accounting for the uncertainties associated with the basic random parameters that define the pipeline's integrity.
At the same time, ILI technology has made significant advances in detecting and sizing pipeline defects so that corrosion rates in a pipeline can now be predicted with reasonable accuracy, notably when multiple inspections are available.7 9 12 This permits development of dynamic models of the pipeline based on the predicted evolution of the defect population with service.1 4 7
Comparing current and future pipeline reliability, measured by the SRA-derived probability of failure, with risk-derived target safety levels produces decision models that can be used for developing strategies to manage pipeline integrity while enhancing return on investment.
Part 1 (OGJ, Jan. 6, 2003, p. 54) proposed methods to produce and use integrity-management decision models based on the relationship between repairs, corrosion rate, operating pressure, and pipeline's remaining safe life.
This conclusion presents a real case that illustrates the procedures proposed to carry out the probabilistic condition assessment of corroding pipelines. The current and future reliability of an in-service oil pipeline is determined with input from the ILI-derived description of the defect population in the pipeline.
Comparing pipeline reliability with target reliability levels produces operator decision models. Together with benefit-to-cost analysis, these models generate optimal future inspection schedules and help prioritize pipeline repairs and corrosion-control measures.
Application of method
The SRA framework outlined in Part 1 is currently applied in the integrity-condition assessment of corroding oil and gas pipelines in Mexico.4 6 The following case illustrates the application of this methodology in the assessment of a corroded onshore oil pipeline.
Pipeline
The Dos Bocas–El Castaño is a 36 in., 60 km (36 mile), 22-year-old pipeline managed by Pemex-Gerencia de la Coordinación Técnica Operativa (GCTO) in southeast Mexico. It began operating in 1980 and is used to transport crude oil (Table 1).
An inspection of the pipeline in 2000 used an ultrasonic (UT) tool ("pig"). The resulting ILI data were preprocessed to correct bias errors with the method described in Part 1 (see Fig. 2a, Part 1).
The random errors associated with the sizing of the corrosion defects were also investigated at this stage (Part 1, Table 1) and the accuracy of the ILI tool estimated to be ±12% of pipe WT 95% of time.
The results of the 2000 ILI (Table 2) show that the main threat to the integrity of the assessed pipeline is corrosion. External (EML) and internal (IML) corrosion-caused metal losses represent 95% and 2%, respectively, of the detected features. All these metal losses show relative depth less than 70% WT. The maximum allowable operating pressure (MAOP) was determined to be 48 kg/sq cm (<680 psi) at the date of the inspection.
Construction and mechanical defects account for 3% of the detected features.
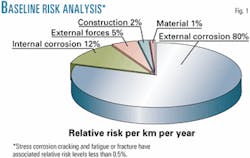
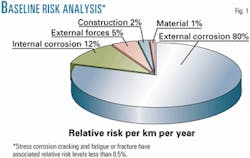
A baseline relative risk analysis combined the ILI data, the pipeline historical failure data, and the information about the expected severity of failures for the different segments of the pipeline. Fig. 1 shows the relative risk associated with different fault causes on a per-kilometer-per-year basis.
External corrosion is confirmed as the most severe threat to pipeline integrity followed by internal corrosion. Even when this result could appear obvious from the analysis of Table 2, it should be stressed that considering the severity of the consequences of a given failure mode could change the relative importance of this mode in a risk assessment.
For example, if IMLs were in high-consequence areas, they could increase the pipeline risk in a greater degree than EMLs, despite their being less abundant.
The results of this analysis also indicate that outside forces (third-party activities) and ground movements (natural hazards) show risk levels higher than those related to structural, construction or material, stress corrosion cracking (SCC), and fatigue or rupture faults.
Failure probability
The time-dependent probability of pipeline failure due to corrosion was evaluated for a 15-year span from the inspection date; Fig. 2 presents the results. The probability of failure is plotted in Fig. 2a for the entire pipeline (Pfailpipe), ranked by kilometer (Pfailkilom) and by between-joints segment (Pfailjoint). Fig. 2b gives the contribution of the burst and leak fault modes to the total failure probability per kilometer.
Considering that the pipeline operates in ASME location Class 1 (Table 1), the target reliability level was assumed to be 1 X 10⁻⁴/km/year (Table 2 in Part 1).13 This safety target determines whether corrosion threatens the integrity of the pipeline. The probability of failure associated with corrosion metal losses was determined to be 7 3 10–4/km within the year of the inspection increasing to 8 3 10–2/km within the next 15 years.
Thus, corrosion represents a significant and unacceptable risk to the safety of this pipeline from the date of inspection. The results presented in Fig. 2b suggest that an immediate remediation program should be planned, focusing on the fact that the burst-rupture failure mode constitutes the major threat to the integrity of the pipeline.
Prioritizing which segments are to be inspected and repaired or inspected for other corrective actions led to the examination of the probability of failure associated with each kilometer in the pipeline. Fig. 3 shows a plot of the probability of failure as a function of time and location for those pipeline segments at high risk.
This figure also gives the target reliability level required according to the ASME location class in the pipeline. The pipeline segments excluded in this graph remain within the safety zone for all the time period analyzed. In agreement with the results shown in Fig. 2, this local failure prediction indicates that the most severe corrosion defects at these risky segments demand rapid corrective actions.
The defects responsible for the low reliability levels determined in the segments included in Fig. 3 were identified. Doing so involved examination of the probability of failure of each defect and comparing each with the required target failure probability. This allows estimation of which defects must be addressed in order to keep these segments within the safety zone.
As result, Fig. 4 shows the number of defects requiring remediation actions within a specified elapsed service time and within the year starting at the service time of interest (yearly number).
These results not only help to establish which defects must be addressed but also provide the basic information to establish the future re-inspection and repair strategy that guarantees safe operation of the pipeline. Table 3 lists the eight most severe EML defects in the pipeline at the date of the inspection according to their failure probability.
The benefits associated with repairing these defects include reassessment of the MAOP to 59 kg/sq cm, reduction of the pipeline failure probability to 3 X 10⁻⁶/ km/year, and increasing the remaining safe life of the pipeline in 4 years.
Decision models
Once the reliability analysis is performed and evolution of the probability of pipeline failure with service known, the operator has several options to manage the present and future integrity of the pipeline: repairing, rerating, and controlling corrosion.
Selecting the appropriate option is a matter of evaluating the most cost-effective solution to pipeline threats, based on the comparison of the failure probability with required target reliability levels.
Benefits
Fig. 5a shows the relationship between repairs and reinspection intervals. In the present case, addressing the most severe corrosion metal losses results in the most noticeable increase in time to next inspection and reinspection intervals because of the significant role that corrosion plays in the integrity deterioration of the assessed pipeline (Fig. 1).
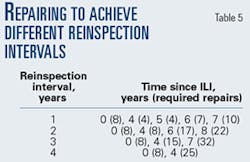
The decision model for repair actions to take is based on the results given in Figs. 4 and 5a. Using these results, the operator is able to schedule the repairs required to optimize the time to next inspection and the frequency of future inspections. Tables 4 and 5 summarize the outcome of this analysis.
For example, repairing the eight most severe metal losses sets the time to next inspection to 4 years, while a reinspection interval of 2 years requires carrying out 8, 17, and 22 repairs after 4, 6, and 8 years from the date of the inspection. In this way, the operator can evaluate the relative benefits and drawbacks of extending the pipeline safe life against inspection frequency.
As expected, reducing the operating pressure increases the pipeline's safe life. This is not of practical interest, however, because the pipeline already operates at a rather low pressure. Accordingly, the benefits of re-rating are considered after repair of the eight most severe metal losses. In this way, both derating and uprating options could be proposed and analyzed.
Fig. 5b shows the decision model for rerating which reflects the influence of the operating pressure on the probability of pipeline failure after the eight most severe corrosion defects have been repaired.
The current operating pressure, which is close to 80% MAOP, imposes a safe working life of 4 years from the date of the inspection. Uprating to 50 kg/sq cm (about 85% MAOP) reduces the safe working life of the pipeline by 2 years setting the time to next inspection to nearly 2 years.
Thus, the operator could chose to increase by about 10% the throughput of the pipeline for about 2 years without the risk of being affected by pressure-induced faults during this period.
On the other hand, uprating to 55 kg/sq cm is rejected because this increases the pipeline failure probability beyond the target probability. Conversely, reducing the operating pressure to 40 kg/sq cm (about 70% MAOP) increases in 2 years the safe working life of the pipeline and sets the time to next inspection to nearly 6 years.
Derating to this pressure, however, reduces the throughput of the pipeline, which significantly reduces the benefits associated with this option. In both cases, derating and uprating, a benefit-to-cost analysis reveals the optimum strategy for risk control. In the present case, the option involving the initial remediation of the most severe defects followed by uprating is the optimum solution as measured by its benefit-to-cost ratio.
The corrosion rates estimated from the ILI data (Fig. 3 in Part 1) determine the probable rate of failure in the pipeline. The most interesting scenario is that in which the corrosion rate is reduced as a result of corrosion mitigation actions such as increasing efficiency of the inhibitor and improving pipeline external coating or cathodic protection. Fig. 5c shows the effect of reducing corrosion rates on the evolution of the pipeline failure probability with service.
Shifting to the left the corrosion rate distribution shown in Fig. 3 of Part 1 produced the decision model (Fig. 5c). The mean values associated with the new distributions correspond to the 85%, 75%, and 50% of the mean value predicted by the ILI. This analysis is conducted considering that the eight most severe corrosion defects were previously repaired.
As expected, the pipeline failure probability increases more rapidly as the corrosion rate increases. The benefits of reducing the corrosion rates are less noticeable, however, than those obtained by derating. A reduction of 30% in the average corrosion rate increases the safe working life of the pipeline only in 1.5 years. This result is a direct consequence of the fact that the pipeline failure probability is dominated by the burst limit state (Fig. 2b).
Corrosion-control measures will have a greater influence on the failure probability of pipelines where leak is the primary integrity concern. When corrosion rate falls by 50%, the time to next inspection increases in 4 years. This option was rejected, however, because it has associated a low benefit-to-cost ratio.
Decision model
An effort to correlate the different options available to manage pipeline integrity led to the investigation of the relationship between the pipeline's remaining safe life, repairs, operating pressure, and corrosion rate. Fig. 5d presents the results of this analysis in the form of a decision model in which the time it takes the failure probability to exceed the target probability appears as a function of the operating pressure, projected repairs, and predicted corrosion rate.
Fig. 5d confirms the well-known facts that the safe working life of the pipeline can be extended by conducting repairs, restricting corrosion, and decreasing the operating pressure. In addition, this figure highlights that:
At low corrosion rates, the increase in remaining safe life associated with derating and conducting repairs is significantly greater than that obtained at high corrosion rates.
At high operating pressure, the benefits of restricting corrosion or conducting a reduced number of repairs are negligible in terms of the pipeline's safe life.
Increasing repairs allows longer safe working periods when the operating pressure is reduced or corrosion is restricted.
The decision model presented in Fig. 5d has more practical than theoretical implications. It assists the operator in making maintenance and operational decisions based on the remaining safe working period projected for the pipeline.
For example, if the safe working period must be extended to 8 years, as shown in Fig. 5d, the operator could either:
- Reduce the present corrosion rate by 50% and keep the operating pressure at 45 kg/sq cm.
- Conduct eight repairs, reduce the corrosion rate by 30%, and reduce the operating pressure to 43 kg/sq cm.
- Conduct 15 repairs and reduce the operating pressure to 43 kg/sq cm.
The optimal strategy must be selected based on the results of a benefit-to-cost analysis.
In the present case, as mentioned, the option involving the initial remediation of the most severe defects followed by uprating is the optimum solution with respect to the benefit-to-cost ratio.
In this sense, it is proposed to repair the eight most severe defects, uprate to 49 kg/sq cm, and reduce the corrosion rate by 15% with respect to the value predicted by the ILI. This strategy will achieve a remaining safe working life of nearly 5 years starting from the date of the inspection.
Future studies include the extension of this methodology to mechanical, fabrication, and material defects and the calibration of the target reliability levels for the specific conditions of pipelines in Mexico.
Acknowledgments
This work was done under agreement between Pemex-PEP-RS and the Instituto Politécnico Nacional. The authors thank Pemex for permission to publish this article.
References
- Jones, D.G., Dawson, S.J., and Brown, M., "Reliability of corroded pipelines," OMAE94 Conference, Houston, Feb. 28–Mar. 3, 1994.
- Pandey, D., "Probabilistic models for condition assessment of oil and gas pipelines," NDT&E International, Vol. 31 (1998), No. 5, pp. 349-358.
- Turley, R., Johnston, D.C., and Kolovich, C.E., "Probability approach promises enhanced maintenance program," Pipe Line & Gas Industry, Vol. 84 (2001), No. 1.
- Caleyo, F., González, J.L., and Hallen, J.M., "A study on the reliability assessment methodology for pipelines with active corrosion defects," Int. J. Pres. Vessels & Piping. Vol. 79 (2002), pp. 77-86.
- Martinez, J.L., and Rodriguez, E., "Tolerable risk criteria for gas transmission pipelines," Pipes & Pipelines International. Vol. 44 (2002), No. 5, pp. 30-36.
- Hallen, J.M., Gonzalez, J.L., Caleyo, F., and Fernandez-Lagos, F., "In-line inspection guides integrity assessment of sour gas," OGJ, Apr. 15, 2002, p. 62.
- Vieth, P.H., "Comprehensive, long term integrity management programs are being developed and implemented to reduce the likelihood of pipeline failures," Corrosion/2002 Plenary Lecture, Mater. Performance, June 2002, pp. 16-22.
- González, J.L., Ramírez, R., and Hallen, J.M., "A mathematical model to predict hydrogen induced crack growth rates in steel plates exposed to sour environments," The Journal of Sci. and Eng. Corr., Vol. 53 (1997), pp. 935-943.
- Cosultchi, A., Hallen, J.M., Gonzalez, J.L., Garcia, A., and Fernandez-Lagos, F., "Reliability of magnetic flux instrument data," Second Pan-American Conference for NDT (PACNDT), ASNT, Houston, June 18-22, 2001.
- Ahammed, M., "Probabilistic estimation of remaining life of a pipeline in the presence of active corrosion defects," Int. J. Pres. Vessels & Piping. Vol. 75 (1998), pp. 321-329.
- Bathia, A., Morrison, T., and Desjardins, G., "Analysis of corrosion growth using high resolution in-line inspection tool," NACE Northern Area Eastern Conference, Otawa, Oct. 24-27, 1999.
- 12. Zimmerman, T.J.E., and Chen, Q., "Target Reliability Levels for pipeline limit state design," Proc. of the International Pipeline Conference, ASME 1996, Vol. 1, pp. 11-130.


