Method predicts brine crystallization temperatures
Daniel P. Vollmer
BJ Services Co., Lafayette, La.
A new method calculates brine crystallization temperatures at elevated pressure based on the true crystallization temperature and the brine composition. The method predicts temperature within 3° F. of the measured value.
Brine density and true crystallization temperature (TCT) determine the selling price of completion brines. In general, cost increases with density and decreasing true crystallization temperature.
Pressure effects
The pressure effects of crystallization temperature became a concern at Shell Exploration & Production Co.'s Ram/Powell tension-leg platform when a 30° F. completion brine crystallized.1 Subsequent tests showed the brine's crystallization temperature at 3,000 psia to be 39° F. or greater.
The TCT at pressure is defined as the pressurized crystallization temperature (PCT). Freeman performed PCTs at 10,000 psi for more than 25 brines and showed a linear correlation with a large error that indicated that PCT increases with increasing pressure. Unfortunately, the reference did not report the composition of each brine tested.
Jeu published additional PCTs for three brines and gave a general 10-20° F. increase in crystallization temperature at 10,000 psi for divalent brines.2 Again, the reference did not report the composition of each fluid.
Because PCT tests are time consuming and expensive, the industry needs an accurate correlation to predict TCT.
PCT equipment can cost in excess of $150,000 and each brine may require a test of several days.
Theory
The basis for determining a PCT is that brine under pressure exhibits a decrease in volume and therefore an increase in density.
One can relate this increase in density under pressure to a brine's density under atmospheric conditions and relate the decrease in volume to the water compressibility factor, although brine compressiblities may prove to be more accurate.
This assumption avoids having to know the brine compressibility factors for different salts and concentrations. Also data for brine compressibility factors are scarce.
The following equation describes the increase in brine density with respect to pressure:
D@pressure = CFW x Datm x P x W + Datm
where:
- D@pressure= Brine density at pressure, ppg.
- Datm= Brine density at atmospheric pressure, ppg.
CFW= Water compressibility factor of 3 x 10⁻⁶ psia–1.
W= Water in the brine, % wt.
P= Pressure, psia.
Using Equation 1 to calculate the brine density under pressure, one can then look up a TCT value for a brine that has the same density at this pressure. This TCT is equal to the PCT.
Single-salt brines
Applying the above equation is a simple task for single-salt brines because the TCT, composition, and density are extensively reported.
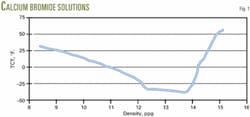
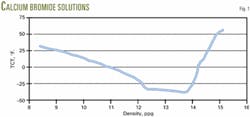
These brines always show an eutectic point (Fig. 1 for calcium bromide solutions). In these brines when small concentrations of salt are added, the TCT decreases until it reaches a minimum that is called the eutectic point. As one adds more salt, the TCT increases until no more of it dissolves at a given temperature.
null
As shown in Fig. 1, the crystallization temperature will decrease at densities less than at the eutectic point as pressure increases cause a greater density. The crystallization temperature will increase at the eutectic point and greater densities.
Testing confirms this phenomenon. Therefore, for deepwater environments, PCTs at densities less than those at the eutectic point are not a concern.
null
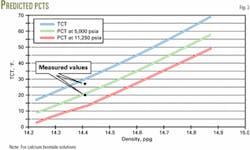
Fig. 2 shows that the predicted PCTs are maximum 3° F. greater than the measured PCTs for densities greater than those at the eutectic point.
Mixed salt brines
Some brines have a unique composition for a given density and TCT, although the references do not provide compositions for these PCTs. This unique composition is always true for single-salt brines and sometimes true for two-salt brines.
null
For mixed salt systems, however, one can use a 12.7 ppg CaCl2/CaBr2 with a TCT of 7° F. reported by Freedman and all the 12 ppg CaCl2/CaBr2 PCT data reported by Jeu.
The procedure is as follows:
- Determine the density, TCT, and the weight percent water for the brine.
- Evaporate enough water to increase the brine's density.
- Measure the brine's TCT and density.
- Subsequently, keep adding water while measuring the brine's TCT and density until the initial density is obtained.
- Plot TCT vs. density.
For example, the composition of the 12.7 ppg CaCl2/CaBr2 with a 7° F. TCT brine was determined to be 55.89% water, having a CaCl2/CaBr2 ratio of 0.648.
The next step placed the brine with a known weight in a 200° F. static oven for a few hours to evaporate water, after which the brine was cooled to about 70° F. Weighing the brine determined the amount of water removed.
Then measured was the density at the temperature along with the TCT of the brine. This was followed by adding small amounts of water and then measuring the density and TCT.
null
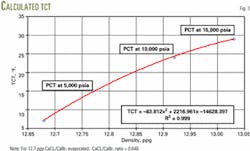
Fig. 3 is the resulting plot from repeating this process until the sum of the small amounts added nearly equal the total amount evaporated. From this plot one can predict the TCT at a specific density.
After establishing the TCT curve, one can calculate the density of the 12.7 ppg brine at a pressure with Equation 1.
Fig. 3 shows the calculated TCT, which is also the PCT at pressure for the 12.7 ppg brine.
Note that the CaCl2/CaBr2 ratio remains constant and only the amount of water changes.
This method predicted the measured PCTs within 2° F. for this particular brine.
By applying the same method for the three 12-ppg brines reported by Jeu, Table 1 shows that this method predicts the PCT at 2,500 psia to 15,000 psia within 3° F.
References
1. Freeman, M., et al., "High Pressure Crystallization of Deep-Water Completion Brines," Paper No. SPE 58729, SPE International Symposium on Formation Damage Control, Lafayette, La., Feb. 23-24, 2000.
2. Jeu, S., et al. "Proper fluid selection controls skin," Hart's E&P, May 2000, pp. 73-75.
The author
Daniel P. Vollmer is region engineer of BJ Services Co., Lafayette, La. He holds a BS and MS in chemical engineering from the University of Louisiana at Lafayette.


