Steam flooding intensifies subsidence at Wilmington field
Water-injection pressure maintenance may slow and ultimately arrest land subsidence in the Wilmington field in California by reducing the potential gradient that drives fluid out of the siltstones. The issue, however, is how to manage the water-injection program effectively to stop subsidence while continuing to produce oil from the reservoir.
Compaction of these low-permeability sediments increases pore pressure that dissipates slowly, resulting in gradually increasing land subsidence for a prolonged period.
Thermal compaction of the Du and D2 siltstones caused the surface subsidence in the Tar zone steamflood area, according to both laboratory rock compression tests and thermal decay (TDT) logs that indicated the susceptibility of shaly siltstones to thermally induced compaction.
Once the Department of Oil Properties, City of Long Beach, Calif., recognized the problem, it terminated steam injection and began warm-water injection for pressure maintenance, and the primary emphasis in Block II-A of the field has shifted away from oil recovery to protecting the Wilmington harbor infrastructure from the effects of land subsidence.
A compaction thermal simulator can address the issue of how to manage this subsidence and still continue producing oil. The simulator can handle the influence of effective stress, temperature, and visco-elasticity (creep) on reservoir compaction and rebound for different rock types.
It models surface subsidence by adjusting the strain functions and creep parameters to account indirectly for the overburden stiffness effects.
Wilmington field
The Wilmington field initially contained about 8.8 billion bbl of oil-in-place within the Tar, Ranger, and Terminal zones in 10 major producing fault blocks.
This article covers the Tar zone of Fault Block II-A, a reservoir that recently has been described in literature1-4 because of research funded by the US Department of Energy. The zone contains heavy oil (14º gravity) in a series of unconsolidated sands interbedded with shaly siltstones.
The study discussed in this article was done during 19975 6 for a project not directly related to the DOE research program for estimating the effects of alternative operating policies on land subsidence.
Oil recovery from Fault Block II-A began during 1937. Subsidence caused by fluid withdrawal reached about 15 ft prior to the start of water injection during 1960.
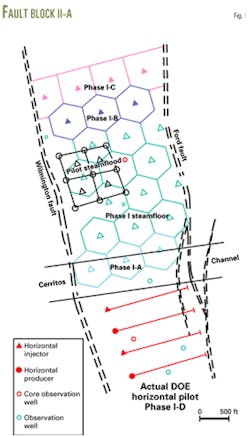
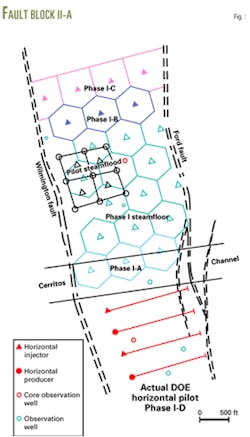
Fig. 1 shows the steam injection pilot installed during 1981 and several later pattern expansions performed sequentially to cover about three quarters of the fault block.
Oil-in-place within the Tar zone of Block II-A was about 75 million bbl at the start of steam injection. Before termination of steam injection during early 1999, thermal operations recovered about 11 million bbl from the zone.
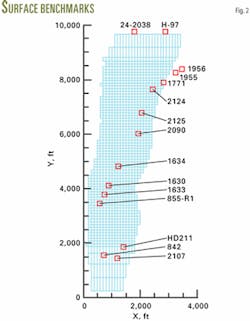
Fig. 2 locates the 15 surface benchmarks in Fault Block II-A within the simulation grid that have enough history to be useful.
Four of these benchmarks are in the cold northern third of the fault block, five are in the central hot area, and six are in the cold southern third.
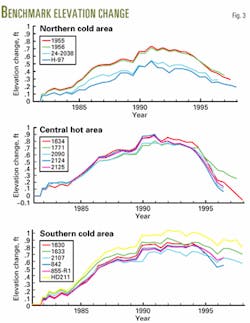
Fig. 3 displays the measured benchmark elevation data.
In all benchmark line graphs, the study adjusted the measured data to zero at the start of steam injection during 1981. Positive and negative changes in elevation represent surface heave (rebound) and subsidence, respectively.
The elevations measured at the five benchmarks in the central hot area fall much more sharply and to a lower level than those measured at the benchmarks in the cold northern and southern areas.
A key question is whether this is due primarily to temperature or pore pressure effects. As described later, the pore pressure has declined to much lower levels in the central third of the fault block.
If the increased subsidence is due to pore pressure, the operator can control this effect by adjusting the ratio of water volumes injected to fluid volumes produced. If, on the other hand, the more pronounced compaction is due to the temperature effect, the solution is more problematic.
Rock types
The Lower Pliocene Tar zone (Fig. 4) is the shallowest productive interval, at 2,250-2,800 ft in Fault Block II-A.
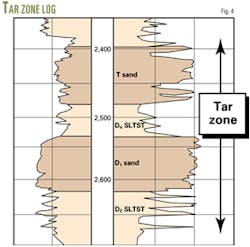
The deepwater turbidite sands are unconsolidated, very easily friable, fine grained, and well sorted. Most of the fine sediments are classified as siltstones that are poorly bedded and frequently contain patches of fine to medium-grained sand.
The siltstones are soft, contain some thin beds of fairly firm to hard shale, and are highly micaceous with frequent inclusions of carbonaceous materials.
Stress induced strain
The simulation required compressibility models for both the sands and siltstones because the reservoir model includes the entire Tar zone, consisting of three sand and two siltstone members.
The study set both the T and D sand rebound and recompression compaction coefficients initially to 6310-6 psi-1 and then slightly increased them during sensitivity simulation runs.
Converse Foundation Engineering Co.,7 as reported by Colazas,8 performed two 1D compressibility tests on Tar zone siltstones. On this basis, the study set all Tar zone siltstone rebound and recompression compaction coefficients to 6310-6 psi-1.
Temperature-induced strain
The Tar zone arkosic sands undergo thermal compaction by crushing of the weaker sand grains. Shear stresses and strains, and not compressive stresses, predominantly cause grain crushing. The magnitude of the effective stress also is important for determining the magnitude of sand thermal compaction.
Previous high-temperature compaction tests9 on siltstones and other reservoir cohesive rocks, such as diatomite,10 have shown that cohesive rocks can resist thermal compaction up to a critical temperature before breaking down in their cohesive bonds as temperature increases.
The breakdown in cohesive bonding makes the rock more compressible. The magnitude of thermal compaction, however, depends on the magnitude of the effective stress compressing the rock.
The thermal compaction also depends on time with the compaction rate also depending on the magnitude of the applied effective stress.
After experiencing thermal compaction in the critical temperature range, further increases in temperature cause little additional thermal compaction.
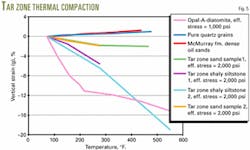
Fig. 5 shows the results of four Tar zone thermal compaction tests performed in a 1D oedometer apparatus on two samples from the D1 sand and two samples from the Du siltstone.
The tests involved each sample being vacuum-saturated with mineral oil and loaded to a 2,000-psi axial effective stress before raising the temperature under conditions of constrained lateral deformation.
The tests show that these siltstones are more susceptible than sands to thermally induced compaction.
Compaction coefficients
These results indicate that both stress and temperature from hot-fluid injection cause reservoir compaction. Thermally induced compaction coefficients, however, are greater than the stress-induced compaction coefficients. Equation 1 (see equation box) shows the relationship for the simplest case of a linear strain function.
In the equation, Kσ and KT are stress and temperature-dependent constant compaction coefficients, respectively.
Typically, Kσ varies from 5 to 10310-6 psi-1 for unconsolidated sands and siltstones of the Tar zone. KT for unconsolidated sands varies from 10 to 1003 ºF.-1, whereas the KT for siltstones varies from 300 to 500310-6 ºF.-1 (Fig. 5).
Modeling reservoir compaction10-6
This study used the compaction thermal simulator (VSTM) that was introduced in 1989 (the box summarizes the thermal simulator treatment of compaction).11
Unlike a conventional flow simulator, the finite-difference grid system of this simulator deforms as the reservoir compacts or rebounds. Strain, or change in reservoir thickness, is formulated as a function of effective stress, temperature, time, and rock type. Porosity is a function of strain and permeability is a function of either effective stress or porosity.
The simulator uses a linear strain entered either as a compaction coefficient (Kσ or KT), one for compression and one for rebound, or a nonlinear strain in the form of a table of effective stress and temperature.
The strain data, creep parameters αi and βi and the power-law exponent γ, for scaling permeability with porosity, are all entered as a function of rock type.
The simulation defines a position-dependent overburden stress array upon initialization and uses a strain function that depends on effective stress (not pressure) to permit modeling the effects of position-dependent overburden stress, as in dipping reservoirs, such as those in Wilmington.
Strain function
The basic assumption in this simulator concerning compaction is that as fluid is withdrawn from the reservoir pore space or as the temperature is elevated, the reservoir compacts in the negative z direction to balance the constant overburden weight according to a given stress-temperature-strain relationship. Equation 1 expresses this mathematically.11
The laboratory test results (Fig. 5) are in the form of the strain function g vs. effective stress and temperature, where Equation 3 defines strain function.
In the equation, the terms Δz and z0 are the changes in the oedometer fractional strain values and the initial sample length, respectively. A negative Δz indicates a compression or compaction and a positive Δz indicates expansion or rebound.
Time-dependent strain
Function g incorporates a time lag, or relaxation time,11 by borrowing the concept of the creep function from the field of visco-elasticity and expressing the strain function as Equation 4.
In Equation 4, G is a function of stress (and temperature) and C(t) is a creep function in the form of Equation 5.
The αi and &946;i are the amplitudes and characteristic frequencies of the creep function, respectively. As time approaches infinity, strain should approach its final value in the absence of creep, which means that parameter a0 should be 1.0.
Notice that at zero time, the sum of the a's is the initial fraction of the final strain value that occurs in response to an effective stress change .
Given a creep function C(t) and a strain relationship corresponding to the no-relaxation case, the computation of g(t) from Equation 4 and substitution into an integrated Equation 2 yields the current reservoir thickness z(t).11
Tar zone model
The Tar zone model has about 7,500 active grid cells to discretize the T, D1, and D3 sands and the Du and D2 siltstones as five separate layers.
The Du siltstone occurs between the T and D sands. The D sand member (Fig. 4) is the D1 sand that directly is underlain by the D2 siltstone, which in turn is underlain by a series of thin, discontinuous D3 sands.
Fig. 2 shows the grid system.
The model uses separate rock properties and compaction related data for the sand and siltstone members. It was built carefully to preserve the geometry of the entire Tar zone framework, using digitized structural contour surfaces and isochors provided by the City of Long Beach.
Simulation procedures
The study initialized the model just prior to steam injection during 1981 and ran it through December 1996 to simulate the entire available thermal history.
The simulator did not model the primary depletion and water-injection periods prior to steam injection. Instead the study used material balance calculations to account for the effects of earlier depletion12 for initializing the model with reasonable estimates of oil, water, and gas saturation.
At the well locations in the model, the study set water saturations at values consistent with relative permeability and fractional flow data as of April 1981. These values were then interpolated onto the simulator finite difference grid.
The difference between unity and the fractional water saturation values determined the oil saturations.
The model included the bottomhole position and completion interval of each well (Fig. 1). Also to match the reservoir pressure trends, the model included water injected into the Tar zone in disposal wells in the southern area of the fault block.
Other data included were the historical injection rates and variable fluid enthalpies (heat contents) for each injection well and the historical, variable gross liquid production rates for each producing well.
The massive well schedule data input file consisted of about 14,000 lines of data.
The Tar zone had available isobaric maps covering 1978-1990. The study used these maps for resetting constant-pressure boundary conditions each year along the northern and southern edges of the model.
Fictitious source and sink wells allowed aquifer water to flow into the model and reservoir fluids to flow out.
Historical operations
The simulation computed the pressure, temperature, saturation, and compaction histories for each model layer.
The pressure has often been higher on the north and south ends of the fault block than in the central area due to natural aquifer recharge. During 1997, at the time of this study, the central area had a computed pressure of about 850 psi, with pressures in the north and south ends of 1,150 psi and 1,250 psi, respectively.
These pressures agree reasonably well with field conditions prevailing at that time.
The match of the reservoir pressure history required a 20-million-bbl water influx from the aquifer on the north end of the fault block and about a 2-million-bbl influx on the south end. About half of the influx entered from the T sand and half from the D1 sand.
The steamflood during a 15-year period injected about 80 million bbl of cold-water-equivalent steam containing about 24 trillion btu. The overall heat balance indicates that only about one sixth of this injected heat currently remains within the D1 sand and one-sixth remains within the T sand.
Fig. 6a displays the computed growth of steam saturation for the D1 sand. Note that only small steam zones develop around each injection well and that a single large steam zone does not form. This is simply a result of the high reservoir pressures that require temperatures in excess of 525º F. for steam-zone development.
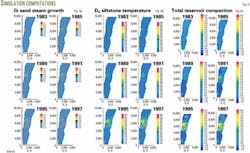
Fig. 6b displays the computed temperature history for the siltstone positioned between the T and D1 sands. The figure also shows the locations of the original steam pilot injection wells and later expansion wells.
As of 1997, the siltstones reached 350-450º F. and the sandstones reached 550º F. temperatures.
Fig. 6c shows the computed compaction surfaces, as total reservoir compaction. Total compaction is the sum of all vertical displacements in both the sands and siltstones of the Tar zone. Total compaction reaches 7-8 ft.
Alternative strategies
Two simulations showed the effects of alternative injection strategies. One simulation continued current steaming operations (hot case) while the other shifted to massive cool-water injection (cool case).
Both the hot and cool simulations provided the same results throughout the historical period from Apr. 1, 1981, to Jan. 1, 1998. The simulations diverged after 1997 in response to the following modeling procedures:
- Hot simulation that continued normal thermal operations, injecting hot water and steam and producing for 5 years from 1998 to 2003
- Cool simulation that converted to cool-water (82 F.º) injection and shut in all production for 5 years from 1998 to 2003,
Both cases shut in the injectors and producers for 12 years from 2003 to 2015 to simulate relaxation of the reservoir toward equilibrium.
Fig. 7 shows the results for the hot simulation. The Du siltstone in the central hot area reaches temperatures exceeding 500 F.º, and total compaction reaches nearly 8 ft. The 8 ft of compaction for the entire Tar zone equals about 8 ft/260 ft or 3% of the total thickness and is much less than the surface subsidence because of the overburden dampening effects.
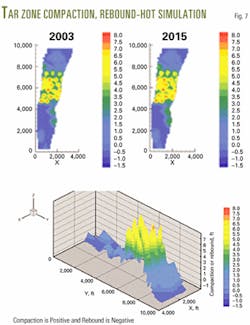
Fig. 7 indicates that the cold northern and southern portions may reach rebound levels of 1-11/2 ft in response to decreasing effective stress in these areas of aquifer influx.
Laboratory work demonstrated that temperature-dependent rebound was negligible; and therefore, it was not allowed in the simulations. Once the sands and siltstones have strained in response to elevated temperature, the loss in thickness is neither expected nor allowed to be regained during cooling.
Cool water injected for 5 years from 1998 to 2003 into the pattern injectors limits the ultimate compaction reached in the central hot area to 6-7 ft.
The simulation limited total cool-water injection to 25,000 bw/d during the cooling period for filling the collapsing steam zones. The siltstones cooled very slowly.
The study set the vertical permeability for the siltstones at 5.0310–4 md to model the 150-psi pressure differential that is known to occur between the T and D1 sands. This required permeability permits only conductive heat transfer, which is a very slow process.
Modeling land subsidence
The finite difference VSTM simulator computes pressure, temperature, saturation, and compaction in the Tar zone at different times. To obtain predictions of surface subsidence, however, the study used creep parameters from Equation 5 to delay and dampen the computed reservoir strains as an indirect procedure to account for the overburden dampening effects.
The effect of increasing the relaxation time (the reciprocal of β) is to delay the onset of compaction. As relaxation time approaches infinity, compaction is delayed further and further, causing reservoir performance to approach the no-compaction case.
The dampening effect of relaxation time on compaction has its maximum effect for a1 = –1.0 and disappears as a1 approaches 0.
The study dampened the compaction surfaces by reducing the laboratory measured strain data for the siltstones (Fig. 5) and globally applied a 973-day relaxation time, a value obtained by history matching the benchmark elevation data.
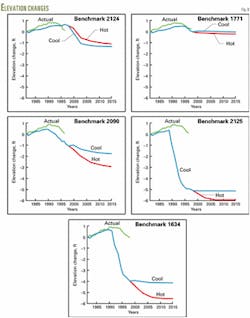
A relaxation time greater than 973 days applied locally in the central hot area should improve the match results (Fig. 8) for Benchmarks 1634, 2090, and 2125, by further delaying the onset of compaction.
Status of operations
The simulator predicted gradually increasing subsidence (Fig. 8) for Benchmarks 1634, 2090, and 2125. This subsidence is alarming and was especially startling when first reported in September 1997.5
Without direct downhole strain measurements, however, the modeling results were not definitive. But TDT logs run in two wells and conventional coring obtained several months later showed 3 ft of compaction in a heated portion of the Du siltstone. Because of this confirmation, the City of Long Beach Department of Oil Properties concluded that thermal compaction of the and D2 siltstones caused the surface subsidence in the Tar zone steamflood area.
This conclusion and the need for protecting the harbor infrastructure led the Department of Oil Properties to decide during early 1999 to terminate all steam injection in the Fault Block II-A Tar zone. It now injects warm water (150º F.) for pressure maintenance using flank injection wells while producing oil and hot fluids.4
Benchmark elevation monitoring indicates that, although slowed, subsidence is continuing in Fault Block II-A.
Modeling shows that high pore pressures have developed within the siltstone strata in response to thermally induced compaction. As thermal compaction starts, the pore pressures increase, thereby decreasing the effective stress and slowing the rate of the thermal compaction.
The study, however, shows that the increased pore pressures slowly dissipate as fluid moves out of the low-permeability siltstones, and eventually the level of strain set by the temperature increase will be reached.
The inference is that the thermally affected siltstones will continue to compact for a period of time until the contiguous sands reach a pressure equilibrium.
The recently initiated water-injection operations4 will help by limiting the levels of effective stress and compaction that are finally reached as the heated siltstones come to equilibrium.
Fig. 8 shows that subsidence continues during shut-in of the Tar zone for years after fluid injection stops, particularly hot fluid injection. This result appears to be caused by the slow continuing siltstone consolidation.
Acknowledgments
The authors thank Dennis Sullivan, Director of the City of Long Beach, Department of Oil Properties (DOP), and Tidelands Oil Production Co. (TOPCO) for permission to publish this article. The results and conclusions expressed in this article are those of the authors; they do not necessarily reflect the views of the DOP or TOPCO personnel. The authors also thank Curtis Chase, developer of the compaction thermal simulator, and Scott Hara, Jeffrey Blesener, Christopher Phillips, and Julius Mondragon for providing field data. F
References
1. Yang, Z., et al., "Method for Handling the Complexities Associated with History Matching the Performance of a Highly Stress-Sensitive Formation," Paper No. SPE 49314, SPE Annual Technical Conference and Exhibition, New Orleans, Sept. 27-30, 1998.
2. Yang, Z., et al., "A Simulation Study of Steamflooding in a Highly Stress-Sensitive Heavy Oil Formation," Paper No. 1998-047, 7th Unitar International Heavy Oil Conference, Beijing, China, November 1998.
3. Davies, D.K., et al., "Geometry, Internal Heterogeneity and Permeability Distribution in Turbidite Reservoirs, Pliocene California," Paper No. SPE 56819, SPE Annual Technical Conference and Exhibition, Houston, Oct. 3-6, 1999.
4. Mondragon, J.J., et al., "Post-Steamflood Reservoir Management Using a Full-Scale 3D Deterministic Thermal Reservoir Simulation Model, Wilmington field, California," Paper No. SPE 62571, SPE/AAPG Western Regional Meeting, Long Beach, Calif., June 19-23, 2000.
5. The Dietrich Corp., Modeling of Steamflood Reservoirs and Effects on Land Subsidence, City of Long Beach, Tar zone, Wilmington field, report to Director, City of Long Beach, Department of Oil Properties, Sept. 15, 1997.
6. The Dietrich Corp., Addendum, Modeling of Steamflood Reservoirs and Effects on Land Subsidence, City of Long Beach, Tar zone, Wilmington field, report to Director, City of Long Beach, Department of Oil Properties, Feb. 20, 1998.
7. Converse Foundation Engineering Co., Tests on Oil Well Cores, report to Board of Harbor Commissioners, City of Long Beach, Sept. 9, 1957.
8. Colazas, Xenophon, C., Long-Term Forecast of Compaction, Subsidence and Necessary Subsidence Control Operations, Wilmington Oil Field, report to the City of Long Beach, August 1979.
9. Chalaturnyk, R.J., Geomechanics of the Steam Assisted Gravity Drainage Process in Heavy Oil Reservoirs, PhD Thesis, University of Alberta, Edmonton, 1996.
10. Dietrich, J.K., et al., "The Thermo-Mechanical Properties of Diatomite and Implications for Numerical Modeling of Steam Injection Processes," confidential report, September 2002.
11. Chase, C.A., and Dietrich, J.K., "Compaction Within the South Belridge Diatomite," SPE Reservoir Engineering, November 1989.
12. Dietrich, J.K., and Little, J.E., "A Method for Determining Reservoir Fluid Saturations Using Field Production Data," SPE Journal, December 1975.

The authors
James Dietrich is a consulting reservoir engineer with TDC-Dietrich Corp., Santa Ynez, Calif. He previously worked for Shell Oil Co. and Shell Development Companies, where he was involved with thermal recovery and reservoir engineering projects. Dietrich has a BA in geology and an MS in engineering from the University of California, Berkeley.

Morris Norman is a computer programmer specializing in data handling and simulation modeling. He has been summarizing global climate data into 1/2° grid data and country average data for the Electric Power Research Institute. For Dietrich Corp., he has developed programs for pre and post-processing of reservoir simulation data. Norman has a PhD in econometrics from the University of Pennsylvania.