Geologic assessment and production forecasts for the ANWR 1002 Area
By all accounts, petroleum comprises a crucial resource associated with the 1002 Area of the Arctic National Wildlife Refuge (ANWR). But if so, how much oil is estimated to exist, and on the basis of what evidence? How much of this resource is believed to be commercial, and at what rates might it be produced? And under what price scenarios?
This second part of a four-part series summarizes the answers.
Such questions are central to the debate over the 1002 Area, as the answers to them serve as a basis for estimating, in turn, potential effects on the Alaska and US economies, including import dependence. However, such answers cannot be delivered simply, with deft mention of a few numbers and percentages. Estimates and predictions require context.
The probability of petroleum in the 1002 Area was identified early on by multiple oil and gas seeps similar to those found across many portions of the North Slope and also by geologic studies performed during the 1970s and 80s.
The culmination of these early studies was included in the 1987 report by Clough et al.,1 mandated by the 1980 Alaska National Interest Lands Conservation Act (ANILCA). The petroleum assessment, performed by the US Geological Survey, estimated an in-place oil resource of billions to tens of billions of barrels, though no predictions as to economic recoverability were made.
In the following decade, a considerable amount of new geoscientific information became available. Additional wells were drilled and new discoveries made along the margins of the 1002 Area. New geophysical data were released and reprocessing of older seismic data performed.
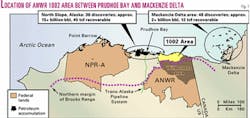
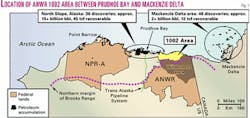
Largely for these reasons, the USGS carried out a second, more rigorous and detailed assessment and released its findings in 1999.2 This new work has expanded significantly the range of analysis to include both the 1002 Area specifically as well as the 92,000 acres of Native Inupiat lands and Alaska offshore territory out to the 3-mile limit (Fig. 1). Moreover, the new assessment also added evaluations for two important categories:
1. Technically recoverable, and
2. Economically recoverable oil, both presented in the form of probability curves (5% to 95% confidence level).
On the basis of this new work, responding to a request by the US Senate Committee on Energy and Natural Resources, the US Energy Information Administration created plausible production scenarios for the total assessment area (1002 Area, plus Native Lands and Alaska offshore area), released in a separate report.3
Together, the recent USGS and EIA studies represent the most current predictions regarding the petroleum potential of the 1002 Area. What follows, therefore, is a summary of the major points covered in these reports.
Geologic overview
The 1002 Area lies along the North Slope coastal plain of Alaska, between the major petroleum discovery areas of Prudhoe Bay to the west and the Mackenzie Delta to the east in Canada.
The northern margin of the Brooks Range, a major thrust-fold system of mainly Tertiary origin, swings northward east of Prudhoe Bay, narrowing the coastal plain significantly (Fig. 1). The 1002 Area comprises part of the foreland basin to this system.
Foreland basin deposits of Paleocene to Miocene age contain the overwhelming majority of petroleum prospects in the 1002 Area. Deposits of this age are placed within the "Brookian Sequence" and consist dominantly of nonmarine and subsidiary marine sediments shed north from the advancing orogen. Thin-skinned deformation, which propagated episodically from south to north, affected Paleocene-Eocene strata, with younger deposits having acted as a passive roof complex.
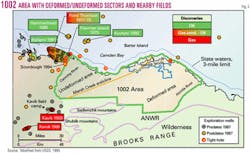
In regard to probable hydrocarbon occurrence, based on evaluation of new discoveries and geoscientific analysis, the 1002 Area can be divided into two structural-stratigraphic domains (Fig. 2).
To the northeast of the Marsh Creek anticline, a major surface and subsurface structural feature, Brookian deposits are largely undeformed and comprise a northward-thinning prism of deposits with significant stratigraphic entrapment possibilities.
South and east of the Marsh Creek structure, deposits are involved in thrust-fold deformation, which generally increases in complexity and intensity to the east.
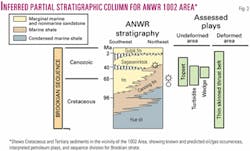
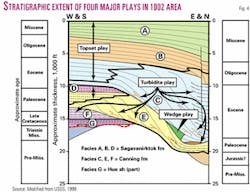
Stratigraphy of Brookian deposits is shown in Fig. 3. Also indicated on this figure are predicted oil and gas occurrences and relevant plays assessed by the USGS. Major units, in ascending order, include the Hue shale, Canning formation, and Sagavanirktok formation.
Together, these units reflect maximum development and infilling of the Brookian foreland basin. The Hue shale (Mid-Upper Cretaceous) is a condensed, deep-marine facies. Canning formation deposits include marine shale and turbidite facies, overlain by deltaic and nonmarine (fluvial) facies of the Sagavanirktok interval.
Geochemical analysis strongly suggests source intervals exist within the Hue and Canning shales. Core studies and core-log correlations indicate reservoir intervals both in Canning turbidites and sandstones of the Sagavanirktok.
Petroleum plays
As many as ten potential plays were identified for the 1002 Area, yet four of these, confined to Brookian strata, are estimated to contain more than 85% of the total oil resource.
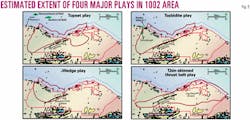
Three of these plays—the topset, turbidite, and wedge plays—were outlined on the basis of identified seismic facies (Fig. 4). These plays are stratigraphic in nature and confined to the undeformed, western and northwestern part of the area (Fig. 5). The fourth is a thin-skinned thrust belt play in the central and eastern, deformed domain (Fig. 5).
Integrated study of log, outcrop, core, and depth-converted seismic data was used to identify and map these four plays. This information, combined with that from oil seeps, surface mapping, and study of nearby fields, suggests a very high probability for significant petroleum occurrence in each of these plays.
Topset reservoirs include rocks within the Sagavanirktok formation and also an updip, clastic-bearing tongue of the Canning formation. They consist of sandstones representing a variety of specific depositional environments in shallow marine shelf, deltaic, and fluvial settings, suggesting variable continuity of sand intervals.
Data from wells in the Kuvlum, Point Thomson, and Hammerhead discovery areas (Fig. 2) show that these reservoirs are often of excellent quality. Parameters range from 3-100 ft in thickness, with porosities and permeabilities of 20-30% and 400-1,000 md.
Turbidite reservoirs are found in the Canning formation and include channel, amalgamated channel, fan apron, and mound facies. Maximum reservoir quality is expected to exist in channel deposits, which have shown porosities and permeabilities in the range of 10-20% and 100-500 md in nearby wells. Oil and gas have been tested from these reservoirs in most nearby fields, such as Flaxman Island, Badami, Tarn, and Point Thomson.
Reservoirs of the wedge play are interpreted to exist in a lowstand prism of Canning formation that pinches out against an Eocene unconformity. While such reservoirs remain below the level of penetration reached by wells, they are inferred, on the basis of detailed seismic analysis, to include facies such as shoreface bars, incised channels, and shingled turbidites. Based on their interpreted depositional setting, these reservoirs are believed to be intermediate in quality between topset and turbidite play sandstones.
The thin-skinned thrust belt play is defined on the basis of structural closures in Brookian strata located in the central and eastern portions of the 1002 Area. Analysis suggests that reservoirs are mainly in turbidites of the Canning formation, with secondary targets in topset marine and deltaic sandstones of the Sagavanirktok formation. Expected porosities and permeabilities are 10-30% and 50-1,000 md. Seismic sections reveal anticlinal and imbricate structures, with closures of 1,000-20,000 acres.
Source rocks and maturity
Two major source rock intervals are interpreted for the four plays discussed above.
The Hue shale of Mid-Lower Cretaceous age is believed to be the origin of hydrocarbons in the turbidite, wedge, and thin-skinned thrust belt plays, whereas shales of the Canning formation are postulated as the primary source for petroleum in topset reservoirs.
Data from wells and existing fields proximal to ANWR, in addition to geochemical analyses of rock and oil samples, indicate that the Hue ranges up to 12 wt % total organic carbon (TOC) in its lower 300 ft, averaging 3-4%. Vitrinite reflectance values in this interval increase from 0.6% at Point Thomson field (Fig. 2) to 1% along the southern margin of the 1002 Area, suggesting that the Lower Hue is thermally mature over the entire coastal plain portion. Deformation and tectonic loading are predicted to have increased maturity levels in the eastern, deformed portion of the area.
Important confirmation of the Hue as a source comes from geochemical analyses of oil-stained outcrops, e.g., along the Marsh Creek anticline.
Canning source beds have not been specifically identified in well samples, but are inferred from several lines of evidence. Distinctive, non-Hue oils are found both in offshore wells (e.g., Hammerhead field) and in coastal seeps from Eocene and younger sandstones. Analysis shows that these oils are similar to those in Tertiary reservoirs of the Mackenzie Delta area (Canada).
The analog source for such oils in the 1002 Area is an organic-rich portion of the Canning formation. Integrated log and sample analysis from onshore wells suggests typical TOC values of 1-2%, ranging up to 12%. Vitrinite reflectance data indicate the interval is marginally mature (Ro = 0.5-0.6%) at depths of 10,000-12,000 ft but should comprise a thick, active pod of source rock in the northernmost onshore and offshore portions of the 1002 Area.
Southward migration of petroleum updip into topset reservoirs is interpreted for the non-Hue oils and for large-scale accumulation within the undeformed portion of the area.
Thermal maturity within the 1002 Area increases to the south and east, with increasing burial and degree of deformation. This is interpreted to suggest that oil resources will be most concentrated in the central and northern part of the undeformed area, with an increasing proportion of natural gas to the south and to the east, in the deformed area.
In place and recoverable oil
Resource estimates for the total assessment area (1002 Area, Native Lands, and adjacent state waters) were based on combined geologic, geophysical, and geochemical analyses and were reported on a probability basis (5 to 95% confidence level).
Many parameters (net pay, porosity/permeability, reservoir drive, GOR, etc.) were used to derive these estimates. A lower limit of 50 million bbl was used for accumulations included in each resource total.
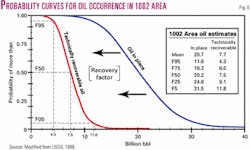
Aggregated results for the total in-place and technically recoverable resource are shown in Fig. 6. The in-place oil resource for the 1002 Area only is assessed to range from 11.6 to 31.5 billion bbl (95 to 5% probability), with a mean of 20.7 billion bbl. This range is higher than that given by the 1987 USGS assessment, which was 4.8 to 29.4 billion bbl (mean = 13.8 billion bbl).
The technically recoverable resource for the 1998 assessment ranges from 4.3 to 11.8 billion bbl, with a mean of 7.7 billion bbl. No estimate of this resource was made in 1987. "Technically recoverable" refers to techniques of recovery available as of 1998, when the assessment was performed. No evaluations were added to account for future advances in recovery technology. This means that the relevant estimates should be viewed as conservative.
Table 1 shows how the technical recoverable resources, including oil and gas, are divided between the undeformed and deformed portions of the 1002 Area. At the 95th, mean, and 5th probability levels, the undeformed portion is predicted to hold 100%, 84%, and 87% of the oil resource, respectively. With regard to nonassociated natural gas, no technically recoverable resource is estimated to exist at the 95th fractile. For the mean and 5th fractiles, 90% and 94% of the gas resource is attributed to the more thermally mature, deformed portion of the area.
Estimates of the number and size of petroleum deposits for the technically recoverable resource were also included in the USGS study. Such estimates for the topset, turbidite, and wedge plays predict that the majority of oil will occur in roughly 30-35 accumulations of 32-512 million bbl each, with a few larger deposits in the neighborhood of 1 billion bbl.
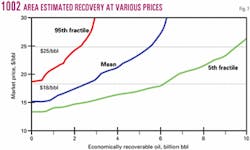
The USGS also assessed economically recoverable resource as a function of price (Fig. 7). "Economically recoverable" includes all costs of finding, developing, producing, and transporting oil to market, here with a 12% return on capital.
As indicated, predicted commercial recovery is very sensitive to price. At $15/bbl, no oil is economically recoverable for the 95th and mean probabilities. At $20/bbl and $25/bbl, however, the corresponding resource increases to 0.75 billion bbl and 2.2 billion bbl (95th fractile) and to 3.2 billion bbl and 5.6 billion bbl (mean).
The most rapid increase in the assessed resource on Fig. 7 occurs at prices in the $18-$25/bbl range: For example, at the mean fractile for this price range, the slope of the curve is approximately 0.40, i.e., every $1 increase in the oil price renders an additional 400 million bbl economical.
Production scenarios
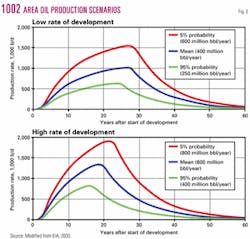
The EIA created production schedules for the entire assessment area for the 95th, mean, and 5th fractile probabilities of the technically recoverable resource (5.72, 10.36, and 15.96 billion bbl; see Table 1).
Scenarios for each fractile included both a low and a high rate of development, based on historical information for North Slope production. Economic considerations, such as oil price, were not included in the construction of these scenarios.
For the development achieved in any one year, it was assumed that production would increase for the first two years thereafter, peak in year 3 at approximately 10% of the total volume, and then begin a 10% exponential decline. A range of 7-12 years was postulated from initiation of exploratory work to first production.
The results for low and high development rates are summarized in the two graphs of Fig. 8. As shown, the low development rate assumes production of 250 million bbl/year for the 95th fractile and 400 million bbl/year for the mean fractile resources. The high development rate scenario raises this to 400 million and 600 million bbl/year, respectively.
At the low development rate, total production reaches a peak in 20-30 years for all three resource probabilities. Using the mean probability as an example, one sees that production reaches about 600,000 b/d by year 10 and exceeds this level for more than 20 years thereafter. Peak production of just over 1 million b/d lasts for 4-5 years. Relatively significant production continues for 40-45 years.
For the high development scenario, production peaks in 15-22 years at significantly higher daily flow rates. For the mean technically recoverable resource, production is about 800,000 b/d by year 10, peaking at 1.35 million bbl/year for a brief 2-3 year period. Significant production continues for 30-35 years. By comparison, production at Prudhoe Bay began in 1977, peaked at 2.2 million b/d in 1988, and has since declined to about 650,000 b/d, 26 years later.
It is important to emphasize that the projections on Fig. 8 are for the total assessed area, i.e., the combined 1002 Area, Native Inupiat Lands, and adjacent Alaska state waters (3-mile limit). Based on Table 1, the technically recoverable resource for the 1002 Area alone amounts to 74% of that for the combined assessed area.
Whether or not all three portions of the total area would be made available to development at the same time remains an open question.
Scale of resource
The summary presented above, and the analyses on which it draws, leave little question as to the general scale of the petroleum resource in the 1002 Area. Though not as large as Prudhoe Bay (13+ billion bbl), the commercially recoverable portion of this resource is nonetheless in the multibillion barrel range at prices such as those targeted by OPEC for its basket crude ($22-28/bbl).
Most of the oil in the 1002 Area lies in the western, undeformed portion, closer to recent, as-yet undeveloped discoveries and to existing infrastructure farther west. Development of these discoveries would undoubtedly be made feasible by 1002 Area exploration.
This is important in view of the interpretation that the 1002 Area is characterized not by a few giant accumulations but instead by a larger number of moderate-sized pools that might therefore require a more complex network of pipeline facilities for development.
Production scenarios suggest that rates of up to 500,000 b/d or more might be achieved within 10 years and 800,000 to 1 million b/d or more within 15-20 years. While such figures are certainly bracketed by uncertainty, they represent the best projections at present and are based on high-quality data.
Finally, it should be anticipated that the commercial resource of the coastal plain area will increase in the future. The US is a mature hydrocarbon-producing nation, with much research devoted to improved oil and gas recovery techniques and technologies.
Continued advances in this domain will almost certainly bear relevance to the types of accumulations in the coastal plain and will therefore raise the total quantity of recoverable petroleum offered by the 1002 Area, Inupiat Lands, and offshore. As a result, this portion of the North Slope seems destined to increase in hydrocarbon value over time.
References
1. Clough, N.K., Patton, P.C., and Christiansen, A.C., eds., 1987, "Arctic National Wildlife Refuge, Alaska, coastal plain resource assessment—Report and recommendation to the Congress of the United States and final legislative environmental impact statement," Washington, DC, US Fish & Wildlife Service, US Geological Survey, and Bureau of Land Management, 1987, Vol. 1, 208 p.
2. ANWR 1002 Area Assessment Team, "The Oil and Gas Resource Potential of the Arctic National Wildlife Refuge, 1002 Area, Alaska," US Geological Survey Open File Report 98-34, on CD-ROM, 1999. Also available online (http://energy.cr.usgs.gov/OF98-34/).
3. Energy Information Administration, "Potential Oil Production from the Coastal Plain of the Arctic National Wildlife Refuge," updated assessment, 2000. Available online (http://www.eia .doe.gov/pub/oil_gas/petroleum/ analysis_publications/arctic_national_ wildlife_refuge/html/anwr101.html).
