US capital expenditures rebound; Canadian spending flat in 2003
Capital spending in the US oil and gas industry will increase 10% this year, with jumps in both the upstream and downstream sectors.
Meanwhile, in Canada, an increase in upstream spending mostly will offset a decline in the downstream sector.
Exploration, drilling, and production activity will recover this year, though not yet to the levels of a few years ago. And the extent of the recovery will hinge on the strength of the general economy and the mitigation of geopolitical uncertainty.
Despite strong oil prices, economic uncertainty decreased capital spending last year, and drilling rates reflected that. Counts of drilling rigs operating in the US declined in 2002 but are rebounding this year, though they will not reach 2001 highs. Operators remain skeptical of putting too much money into drilling and production as long as economic uncertainty and geopolitical conflict remain.
The results of this report are culled from Oil & Gas Journal's annual capital expenditures survey of oil and gas companies based in the US and Canada. All figures are in US dollars.
US gas market drivers
Cold weather, already-low inventories, lagging imports, and declining domestic production combined this past heating season to drive up natural gas demand and prices in the US.
The coldest winter in some years boosted heating demand. Most regions outside the far western US experienced temperatures that were much colder than last winter. Heating degree days (HDDs) in the Middle Atlantic region through Feb. 22, 2003, were almost 8% higher than normal and more than 36% above last year's level, reported the US Energy Information Administration
Gas in storage began the heating season at the top of the 5-year range, but decreased net imports—down 4% in the first 10 months of 2002—and lower production combined with lower-than-expected temperatures to put a strain on gas inventories.
The amount of working gas in storage, as reported by EIA, ended February at 838 bcf, below the 5-year historical range.
This is also down from 1,819 bcf a year earlier. The 5-year average for the end of February is 1,440 bcf. For the week ended Mar. 14, 2003, gas in storage further declined to 636 bcf, down from 1,636 bcf a year earlier.
Spot prices and futures prices for gas surged during the second half of February as the Henry Hub spot price exceeded $18/MMbtu on Feb. 25.
Also that day, the New York Mercantile Exchange price of gas for March delivery closed at a high of $9.577/MMbtu.
In its March Short Term Energy Outlook, EIA estimated that US gas production declined 2.8% last year; it projected an increase of 1.2% this year. The agency reasons that natural gas-directed drilling will get a boost from higher prices this year, but warns that significant output growth is not likely.
The oil market
Colder-than-normal weather has also been a factor in the oil market, as heating oil demand has kept US inventories low and prices elevated.
But the single biggest influence on oil prices over the past few months has been the strike in Venezuela, which severely reduced exports from that country.
Additionally, a war premium leading up to war with Iraq is believed to have buoyed oil prices since the first half of 2002. Some estimates put this premium as high as $8/bbl.
One of the primary sources of US crude, Venezuela, produced 710,000 b/d of oil in December, according to International Energy Agency estimates. This compares to prestrike November production of 2.66 million b/d.
Inventories outside the US have been less constrained, and other members of the Organization of Petroleum Exporting Countries have ramped up exports to make up for loss of Venezuelan crude.
The latest estimates from EIA show a 600,000 b/d increase in worldwide oil demand this year.
Meanwhile, total non-OPEC production is expected to climb 1.3 million b/d from last year.
US upstream spending
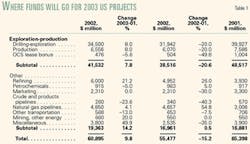
This year, companies will increase capital spending on US upstream projects by 8%. This follows a 21% decline last year. Stronger oil and gas prices, primarily caused by strains on supply, are expected to boost spending.
The sputtering economy and ample inventories at this time last year deterred drilling activity and 2002 spending plans.
Total upstream spending in the US will move up to $41.5 billion, still less than 2001 spending of $48.5 billion.
Capital expenditures for exploration and drilling will total $34.5 billion, and OGJ estimates that $3.7 billion of this will be spent on geological and geophysical costs.
Outlays for US production and enhanced recovery projects will be $6.6 billion, growing at the same rate as those for exploration and drilling.
The Baker Hughes Inc. count of active rotary rigs in the US, an indicator of upstream activity, has been slowly trending positive since reaching a recent monthly average low of 750 in April 2002.
The count averaged 856 rigs for last year and climbed to 907 for February from January's average 854 rigs.
Outer Continental Shelf lease bonus payments are expected to fall this year despite the fact that the Minerals Management Service plans to hold three lease sales compared with two last year.
MMS expects that bonus payments will total $476 million this year, down from $504 million last year and $1 billion in 2001.
The three lease sales this year are Sale 185, which took place on Mar. 19, and involved areas in the central Gulf of Mexico (GOM); Sale 187, scheduled for Aug. 20, involving the western GOM; and Sale 189, scheduled for Dec. 10, for tracts in the eastern GOM.
Other US expenditures
Nonupstream spending in the US this year will jump 14%. While refining expenditures will be higher, spending for petrochemical, pipeline, and other transportation projects will mostly move lower. OGJ estimates total spending for the category at $19.4 billion.
The survey indicates that refining expenditures will increase 21% this year, following a similar increase last year. In addition to pressure to increase capacities due to growing product demand, refiners are facing tougher environmental restrictions that force upgrades and revamps to existing processing units. Total US refining capital expenditures are pegged at $6 billion this year.
Spending in the US petrochemical sector will dip 5%, the same amount by which it increased last year.
This will put 2003 petrochemical capital spending at $915 million. Marketing expenditures are expected to be unchanged at $2.3 billion.
Pipeline spending will vary, as expenditures increase for natural gas pipelines and decline for crude and products pipelines.
In all, more than 4,700 miles of pipeline construction is planned this year in the US (OGJ, Feb. 3, 2003, p.64).
With 364 miles of construction planned, spending for crude and products pipelines is estimated at $260 million.
This is down from $340 million last year. In 2001, crude and products pipelines expenditures totaled $570 million. US gas pipeline expenditures will increase 4% this year to $4.85 billion. This is based on planned construction of 4,359 miles of pipeline.
Capital spending in the US on forms of transportation other than pipelines will shrink 13% following a 7.5% slide last year.
Companies will spend 20% more on mining and other nonpetroleum projects than during the past 2 years. And miscellaneous capital spending will jump 50% to $3.8 billion.
Capital expenditures in Canada
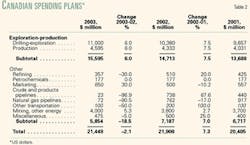
Capital spending in Canada overall will decline 2%, although the heavier-weighted upstream sector will see increased expenditures.
Downstream spending will be off more than 18% from a year ago.
Total 2003 capital expenditures in Canada will be more than $21 billion.
Canada's ratification of the Kyoto Protocol on Climate Change will limit spending growth, as it will take a while for industry to learn all the details behind the agreement.
As in the US, spending in Canada will get a boost from stronger demand and prices. The Baker Hughes count of active rotary rigs in Canada has gained year-on-year so far in 2003.
The count in January was 478, up from 405 last year, and February's average was 554 compared with 433 a year ago.
Upstream spending will continue a string of increases, moving up 6% following last year's growth of 7.5%. In 2001 upstream spending increased 30%. Exploration and drilling outlays will total $11 billion this year, and production expenditures will be $4.6 billion.
Reduced pipeline construction—largely the result of flat or declining supplies and adequate capacity—will drastically diminish expenditures in Canada's downstream sector. Total downstream spending is forecast at $5.9 billion, down from $7.2 billion last year and $6.7 billion in 2001.
Plans call for 56 miles of gas pipeline construction this year, sending expenditures in this area to $72 million, down from $762 million last year. Meanwhile, crude and products line construction is pegged at just 38 miles with spending estimated at $23 million, a 97% decline in such expenditures compared with last year.
Spending on modes of transportation other than pipelines will decline 50% to $100 million, the same level as in 2001. Petrochemical capital expenditures will be unchanged from last year at $177 million, and marketing expenditures will increase 30%. Spending for refineries will fall to $357 million from $510 million last year and $425 million in 2001.
Capital expenditures for all other energy projects, including oilsands, will increase 4% this year to $4.5 million. Such expenditures gained 5% last year.
Spending outside US and Canada
Capital spending outside the US and Canada will move up slightly this year, as indicated by OGJ's survey.
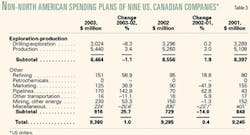
Table 3 shows the collective spending plans of nine surveyed companies that operate outside the US and Canada. Three major oil and gas firms and six large independents comprise this group of companies. All are based in the US.
The group plans to decrease spending for upstream projects and boost refining, marketing, and pipeline spending.
These nine firms plan to spend $9.4 billion outside the US and Canada this year, compared with $9.3 billion last year and $9.2 billion in 2001.
Most of these expenditures are allocated for exploration and production. Production expenditures will move up 3% from last year, while exploration spending will decline 8%. Each of these categories of spending increased last year, though only for a combined change of less than 2%.
This group of companies will increase spending on all other projects 26%. Expenditures for all of these categories—by the same nine companies—declined 14% last year.
The largest gain in spending will be for pipelines, with a planned increase of 143%. These companies plan to invest $170 million in pipelines this year. Investments in other forms of transportation are projected to fall 11%.
While none of these companies have petrochemical operations outside the US and Canada, they will boost refining expenditures 59%. Last year, their petrochemical outlays increased 19%. Marketing expenditures will rebound 39% to $125 million following a 42% decline last year.
All other capital expenditures by this group of companies will be nearly unchanged at $454 million. This category includes mining and other energy projects. In 2003, the group spent $553 million on these items.


