Simple predictive procedure calculates heptane K-value
A simple equation presented here provides good estimates of C7+ K-values, also known as equilibrium ratios. The equation is based on ethane and n-heptane K-values. It only requires the linear slope from a graph of the log of K-values vs. the square of normal boiling point.
The only required information is the C7+ fraction normal boiling point. The choice of ethane and n-heptane is arbitrary; one can use any other pair of components such as methane and n-hexane.
We tested the equation's accuracy against experimental data using the Soave-Redlich-Kwong equation of state. The overall average absolute error for the experimental data and the SRK was 7.41%.
For Winn's equation1 the error was 9.93%. Winn's equation is the only other method, which we are aware of, for calculating C7+ K-values.
Vapor-liquid calculations
When modeling and designing many types of equipment for separating gas and liquids—flash separators, distillation columns, and even pipelines—engineers commonly assume that the phases present are in vapor-liquid equilibrium (VLE). The equilibrium ratio, or K-value, for a component describes the ratio of vapor and liquid compositions for that component present at a given temperature and pressure.
Moshfeghian and Maddox reviewed K-value determination methods for hydrocarbon mixtures made up of known, identifiable pure components.2
In many cases, real fluid mixtures contain dozens, if not hundreds, of components; one cannot practically consider each component because experimental determination of each component is not feasible or possible.
More importantly, the VLE calculations for systems containing large number of components are time consuming.
In fact, our experience shows that required calculation time increases exponentially with the number of components in the mixture. To overcome this time constraint, it is common for one to lump together components heavier than hexane and their derivatives as one or more pseudo-components and call them "heavy ends," or C7+.
Many references provide techniques for characterizing C7+ fractions. Maddox and Lilly3 and Danseh4 present detailed techniques that characterize heavy ends or C7+ fractions. More recently, Shariati, et al., presented a systematic approach.56 Campbell presents several short-cut approximation methods.7
The C7+ fraction frequently defines the gas dew point. Liquid formation in a natural gas pipeline changes the line pressure drop and flow characteristics. A seemingly inconsequential amount of liquid can cause significant changes in line pressure drop and capacity.
Shariati, et al.,8 and Moshfeghian, et al. (OGJ, Feb. 4, 2002, p. 56) studied the importance and impact of heavy ends characterization on design and projected operation of gas pipelines.
Proposed procedure
Winn developed a simple equation for estimating C7+ K-values:1
where:
b = Volatility exponent and is a function of atmospheric boiling point.
K7 = K-value of pure heptane.
K2 = K-value of pure ethane.
Winn also presented a figure that shows b as a function of atmospheric boiling point temperature for the C7+ cut.
The choice of ethane and heptane as the base components is arbitrary. Any other pair of components works equally well. Winn did not present an extensive evaluation of the equation.
Based on Winn's reasoning, we developed a similar equation. Our proposed equation for estimating the K-value of C7+ is expressed in terms of the ethane and n-heptane K-values using:
KC7+ = m(K2)1-n (K7)n
where:
m = Proportionality constant. We recommend a constant value of 1.15.
n = Volatility slope.
To determine n, one assumes that the logarithm of the VLE K-values is directly proportional to the square of the absolute temperature normal boiling point.
Based on this assumption, n is calculated using:
null
where:
NBP = Normal boiling point, K. or °R.
We tested the proposed equation's accuracy against experimental data reported by Yarborough and Vogel.9
Example 1
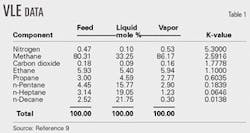
Yarborough and Vogel reported a series of experimental VLE measurements on the mixture in Table 1. Table 1 presents experimental data at 1,547 psia and 200° F.
Problem
Estimate the K-value for an undefined fraction using the experimental K-values for ethane and n-heptane and the normal boiling point (345.47° F.) of n-decane.
Solution
Normal boiling points are:
C7+ cut = 805.14° R.
Ethane = 332.21° R.
n-Heptane = 668.80° R.
From Equation 3:
n= [(805.14)22(332.21)2]/ [(668.80)22(332.21)2] = 1.5964
For m = 1.15:
KC7+ = 1.15(1.1)(1-1.5964)(0.0646)(1.5964)
= 0.0137
Compared to the experimental K-value of n-decane, the error = 100 (0.0138-0.0137)/0.0138 = 0.747%.
We performed similar calculations for other pressures. Table 2 shows the calculated K-values for C7+, percent error for each pressure, and the overall average absolute percent errors.
The experimental KC7+ in Table 2 is actually the K-value for n-decane, which we treated as a C7+ fraction. Table 2 also presents the C7+ K-values that we calculated using the Winn equation (Equation 1 with b = 0.56 for a normal boiling point of 345.47° F. of n-decane).
Example 2
Maddox and Lilly suggested the following step-by-step procedure for predicting C7+ fraction K-values:3
1. Use correlations similar to those of Riazi and Daubert10 to estimate critical temperature (Tc) and critical pressure (Pc) based on normal boiling point and relative density.
2. Use Tc and Pc from Step 1 to predict vapor pressure using an equation of state at the normal boiling point. Adjust the accentric factor so the calculated vapor pressure becomes 1 atm.
3. Treat C7+ as a pseudo component and the other components as standard to perform VLE calculations.
Problem
Rework Example 1 using the SRK11 equation of state to estimate the K-value of n-decane treated as a C7+ cut that has a relative density of 0.7342 and normal boiling point of 345.47° F.
Solution
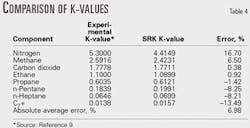
We used a software package (EZThermo, copies are available by contacting the authors) to estimate the mixture's properties (Table 3), which were then used in a flash calculation at 1,547 psia and 200° F.
Table 4 shows the K-values that we generated using the SRK option in EZThermo.
Table 5 shows C7+ K-value calculations for other pressures, the percent error, and the overall average absolute percent error.
The experimental KC7+ reported in Table 5 is actually the K-value for n-decane, which we treated as C7+. Table 5 also shows C7+ K-values predicted by the Winn equation (Equation 1 with b = 0.56 and a normal boiling point of 345.47° F. for n-decane), as well as errors compared to the SRK prediction.
Acknowledgment
The authors thank the school of chemical engineering at Oklahoma State University for facilities support and Chemical Engineering Consultants Inc. and John M. Campbell Co. for financial support.
References
1. Winn, F.W., "Equilibrium K's by Nomograph," Petroleum Refiner, August 1954, pp. 132-36.
2. Al-Sayegh, A., Moshfeghian, M., and Maddox, R.N., "Calculating and Applying K-Values," Proceedings of 12th Oil, Gas, and Petrochemical Conference, Tehran, Feb. 24-26, 2003.
3. Maddox, R.N., and Lilly, L.L., "Gas conditioning and processing, Vol. 3: Advanced Techniques and Applications," John M. Campbell and Co., Norman, Okla., 1994.
4. Danesh, A., PVT and Phase behavior of Petroleum Reservoir Fluid, 2nd edition, Elsevier BV, Amsterdam, 2001.
5. Shariati, A., Peters, C.J., and Moshfeghian, M., "A Systematic Approach to Characterize Gas Condensates and Light Petroleum Fractions," J. of Fluid Phase Equilibria, Vol. 154 (1999), pp. 165-79.
6. Shariati, A., Peters, C.J., and Moshfeghian, M., "Further Evaluation of the Shariati- Peters-Moshfeghian C7+ Characterization Method," J. of Fluid Phase Equilibria, Vol. 179 (2001), pp. 23-41.
7. Campbell, J.M., Gas Conditioning and Processing, Vol. 1: the Basic Principles, 7th edition, John M. Campbell and Co., Norman, Okla., 2000.
8. Shariati, A., Moshfeghian, M., and Maddox, R.N., "The Effect of Correct C6+ Characterization on the Computer Simulation of Two-Phase Flow Pipelines," International J. of Modeling and Simulation, Vol. 19 (1999), No. 4, pp. 352-56.
9. Yarborough, L., and Vogel, John L., "A New System for Obtaining Vapor and Liquid Sample Analyses to Facilitate the Study of Multicomponent Mixtures at Elevated Pressures," Chem. Engr. Symposium Series, Vol. 63, No. 81.
10. Riazi, M.R., and Daubert, T.E., Hydrocarbon Processing, March 1980, p. 115.
11. Soave, G., Chem. Eng. Sci., 27 (1972), pp. 1197-1203.
The authors
Mahmood Moshfeghian currently teaches in the chemical engineering department of the University of Qatar, Doha, and remains a professor of chemical engineering at Shiraz University, Iran. Moshfeghian holds a BS, MS, and PhD in chemical engineering from Oklahoma State University. He is a member of the Iranian academy of sciences, Iranian Petroleum Institute, and Iranian Association of Chemical Engineers.
Arland H. Johannes is professor of chemical engineering at Oklahoma State University, Stillwater. From 1977 to 1984, he was a professor of chemical engineering at Rensselaer Polytechnic Institute, Troy, NY. He holds a BS (1970) in chemistry and physics from Illinois State University, an MSE (1974) in civil engineering from West Virginia University, and a PhD (1977) in chemical engineering from the University of Kentucky. He is a member of AIChE.
Robert N. Maddox is the Leonard F. Sheerar Chair emeritus professor of chemical engineering at Oklahoma State University. He served as head of the chemical engineering department from 1958 to 1978. He is a fellow of AIChE and a member of GPA.


