PIPELINE INSPECTION—1: Reliability-based method assesses corroding pipelines

In the last two decades, results obtained from structural reliability analysis (SRA) have increasingly led to formation of strategies for future safe operation of corroding oil and gas pipelines.1-8 A safe operating strategy includes determining optimal reinspection intervals, scheduling rerating, reducing corrosion rate, and repairing or replacing pipeline sections when unavoidable.
Use of probabilistic approaches to evaluate the integrity of corroding pipelines is beneficial because the uncertainties associated with in-line-inspection (ILI) tools, corrosion rate, pipeline geometry, material properties, and operating pressure can be modeled and considered over any chosen time period.3 4 7
This information allows determination of the reliability of the pipeline quantitatively by, for example, computing its probability of failure with use of structural reliability methods.7 9 The probability of failure can be determined for the entire pipeline and ranked by segment between joints or for a given characteristic length.
Then, it can be compared with target probabilities established either from historic failure rates or from risk criteria.10-12 This comparison allows the operator to formulate cost-effective strategies for the future safe operation of the pipeline.
Efforts are under way to assess the condition of corroding pipelines with data obtained from high-resolution magnetic flux leakage (MFL) or ultrasonics-based (UT) ILI tools, also known as "smart pigs." Recently, the Pipeline Integrity Assessment Group (GAID, in its Spanish-language acronym) of the National Polytechnic Institute (IPN) in Mexico developed a generalized probabilistic method through collaboration with Petróleos Mexicanos.7
This method allows use of the data derived by ILI for fitness-for-purpose reliability assessments13 and is capable of including several failure models and reliability algorithms to determine the probability of failure of pipelines containing active corrosion defects.
This is the first of two articles based on a study of reliability-based assessment for developing strategies to ensure pipeline integrity.
This article presents the procedures employed to carry out the probabilistic condition assessment of corroding pipelines.
The concluding article, next week, will present application of the method, in which the reliability of an in-service oil pipeline will be determined and compared with internationally accepted target reliability levels. The results will be used to formulate operating and maintenance strategies that guarantee the safe operation of this pipeline over its targeted service life.
Assessment framework
The reliability framework used to assess the condition of corroding pipelines can:
- Identify relevant failure modes and establish the corresponding limit states.
- Account for the errors associated with the ILI data sets.
- Model uncertainties of the basic random variables.
- Formulate limit states functions and evaluate pipeline reliability.
- Compare reliability with target safety levels and plan future safe operation.
The following sections describe each of these steps.
Failure modes
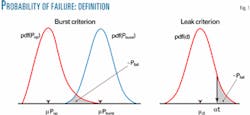
When corrosion is the primary failure mode, two limit states are of immediate integrity concern: burst or rupture and leak.
Burst threatens pipeline integrity when the operating pressure (Pop) exceeds the predicted burst pressure (Pburst). Leak threatens pipeline integrity when metal loss (d) due to corrosion exceeds a given percentage a of the pipe WT.
(Defect depth will be represented by d, generic defect depth; d0, defect depth as detected by the ILI tool at the date of the inspection (t = 0); and d(t), time-dependent defect depth. The same notation is used for defect length.)
The value of a is commonly selected in the 80-100% WT range. In some cases, a is set to 80% WT4 8 in order to meet the limit condition stated in the Code B31G (American Society of Mechanical Engineers) for defect depth.14 In our methodology, a is set to 100% WT in order to reduce the conservatism associated with this limit condition.
Once the probability distribution functions (pdf) of Pop, Pburst, and d are established through uncertainty analysis, the probability of failure (Pfail) associated with each corrosion defect can be calculated for these two limit states using standard reliability methods.9 Fig. 1 presents an interpretation of Pfail.
ILI errors
In this stage, ILI data that describe the type and size of corrosion defects detected in the pipeline are compared with data obtained by in-field measurements for a representative number of defects. An equal probability-without-replacement sampling scheme is used to select these defects from the preliminary list reported by the ILI tool.
From this comparison, any σystematic deviation from the ideal 1:1 relationship between the ILI and the field data can be corrected, and the nature of the random errors associated with the inspection tool can be determined.

To illustrate this method of analysis, Fig. 2 shows a unit plot in which the corrosion depths reported by the ILI tool are correlated to those obtained by in-field inspection for 79 corrosion defects found in the pipeline that will be assessed in the conclusion of this series next week. This ILI was conducted with a UT pig for which the vendor stated a depth sizing accuracy of ± 3% WT at 95% confidence.
As Fig. 2a shows, the ILI tool shows a linear tendency to underestimate metal losses with increased defect depth. This behavior is fitted to a straight line using linear regression analysis. The σystematic errors associated with the ILI data are corrected using the fitting parameters of the linear relationship found (Fig. 2b). This yields a better approximation to the actual size of the defects in the pipeline from the data derived by ILI.
Once the ILI data have been corrected for bias errors, the nature of the random errors and the true accuracy of the ILI tool are determined. In the case presented in Fig. 2, only 67% of the compared depths falls within the ±3% WT error bounds. The accuracy stated by the vendor is not achieved in practice, therefore.
If one assumes the random errors in this figure to be normally distributed, then the true accuracy of the ILI tool can be estimated to be ±12% WT 95% of time. This agrees with the value achieved in the regression analysis for the standard deviation of the model (6% WT) and the corresponding 95% prediction bounds. The errors associated with the length of the detected defects were characterized using the same procedure.
Model uncertainties
In an SRA pipeline assessment, the accurate characterization of the probabilistic distribution of the basic random variables on which the probability of pipeline failure depends is key in achieving results with a reasonable degree of confidence.1-3 13
In this study, the variability of the operating pressure is modeled with a Gumbel (EV Type I) distribution that is estimated from operating records of the pipeline over its service life. The uncertainties related to the pipeline geometry and material strength (physical uncertainties) were obtained from databases published in the literature.5 The probabilistic distribution of depth and length of corrosion defects (measurement uncertainties) is established from comparison of ILI data with in-field measurements (Fig. 2).
When multiple inspection records are unavailable, the local corrosion rates are estimated by dividing the defect depth and length by the pipeline's age at the date of the inspection. With multiple inspections, the corrosion rates are estimated from the observed changes in defect size from one ILI to the next.
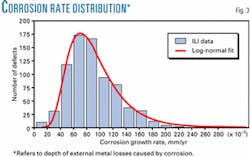
The variability of the radial and axial corrosion rates is predicted from the actual depth and length distributions found in the pipeline. As an example, Fig. 3 shows the experimental distribution of corrosion rates in depth for external metal losses (EML) in the pipeline that will be assessed in this series' concluding article.
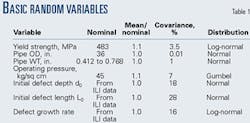
Table 1 lists the statistical characteristics of the basic random variables used in the condition assessment of this pipeline.
Limit-state functions
The failure modes and limit states defined previously lead to the formulation of two limit-states functions (LSFs).
The first is the difference between the pipeline burst and operating pressures, LSFburst = Pburst – Pop. The modified B31G burst criterion15 was used to compute Pburst as the real pipeline failure imposed by each defect.
The second LSF is the difference between the pipe WT and the corrosion defect depth, LSFleak = t – d. In both cases, the conditions LSF > 0, LSF = 0, and LSF < 0 represent safe, limit and failure states, respectively.
The basic random variables on which these LSFs depend are: the defect depth (d) and length (L), the pipeline WT (t) and diameter (D), the material yield strength (σys), the radial (υrc) and axial (yac) corrosion rates, and the operating pressure (Pop). These variables are assumed to be mutually independent, and the probability of failure due to each LSF is computed with the first-order second-moment (FOSM) reliability method.9
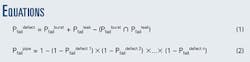
The probability of failure associated with each defect Pfaildefect is computed as a combination of the probabilities of failure due to the burst Pfailburst and leak Pfailleak limit states, as in Equation 1 (in the accompanying equations box).
The probability of failure of the entire pipeline Pfailpipe is estimated considering it as series σystems with n independent critical elements. In this "weakest-link" σystem approach, the probability of failure of each defect sums up to the cumulative pipeline failure probability, according to Equation 2.
The probability of failure can be computed for the entire pipeline (Pfailpipe) or ranked by between-joints segment (Pfailjoint) or ranked by kilometer (Pfailkilom). In the two last cases, only the probability of failure of defects in the chosen segment is used to compute the corresponding probability of failure.
The evolution of the probability of failure with time is determined from the projected changes in defect depth and length with time, d(t) = d0 + υrc(t – t0) and L(t) = L0 + υac(t – t0), where t = time; t0 = time of the inspection; and υrc and υac = the radial (depth) and axial (length) corrosion rates, respectively. (Note that t is used to represent pipe WT; t is used to represent time.)
It is important to emphasize that d(t) and L(t) refer to the dependence of the mean values of defect depth and length on time. The probabilistic distribution of these variables is determined for any future time as a combination of the distributions given in Table 1 for d0, L0, υrc, and υac.
Comparing reliability
Once computed, the probability of pipeline failure can be compared with target safety levels in order to determine whether the current and future integrity condition of the pipeline is acceptable with respect to the targeted operational and safety goals. This comparison is also the key for developing strategies to ensure the safe and cost-effective operation of the pipeline over its targeted service life.
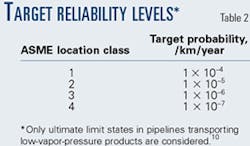
Table 2 lists the values used as maximum allowable failure probabilities for the different safety classes based on the pipeline location. A weakest-link approach10 was assumed and the safety levels were selected on a per-kilometer-per-year basis. Data in Table 2 correspond to target reliability levels commonly recommended in the literature5 10 11 for ultimate limit states (ULS) in pipelines transporting low-vapor-pressure (LVP) products.
It should be stressed that although this approach does not consider consequences explicitly, the reliability target levels are established through risk analyses or from historical failure databases which describe the actual trend in pipeline-failure incidence and consequences for the petroleum industry worldwide.
In the final stage of the present SRA methodology, the probability of failure of the pipeline is compared with the target probabilities listed in Table 2 in order to determine the actions that guarantee the safe operation and cost-effective maintenance of the pipeline over its projected service life.
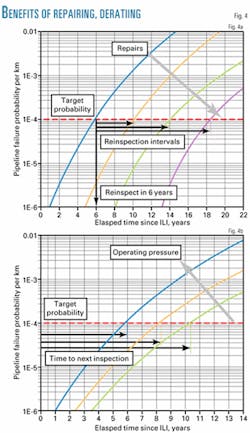
As an example, Fig. 4 illustrates how this comparison is carried out to assess the benefits of remedial actions such as conducting repairs (Fig. 4a) and de-rating (Fig. 4b). In this study, the time it takes the failure probability to exceed the target probability is assumed to be the remaining safe life of the pipeline and the time to next inspection.
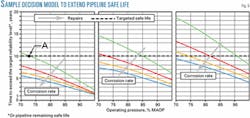
Fig. 5 shows the technique used to investigate the relationship between repairs, operating pressure, corrosion rate, and pipeline's remaining safe life. This analysis produces a decision model from which the operator can select the optimal option to achieve the safety goals projected for the pipeline.
The model is based on the dependence of the "safe remaining life" function on repairs, corrosion rate, and operating pressure. The range of this function beyond the point where it crosses the operator comfort level for pipeline's remaining safe life, Point A in Fig. 5 for example, represents the spectrum of all available integrity-managing options to achieve and improve this level of comfort.
A benefit-to-cost ratio is used in order to select the optimal crossing, based on minimizing the cost associated with the remediation actions while maintaining the minimum comfort level.
Combination
The SRA methodology outlined here combines high-resolution ILI data with fitness-for-purpose probabilistic assessments to determine the current and future integrity condition of corroding pipelines.
The method of analysis proposed is capable of establishing the limit states for the relevant failure modes, accounting for the errors associated with the ILI data sets, modeling the uncertainties of the basic random variables, evaluating pipeline reliability, and comparing reliability with target safety levels in order to plan the future safe operation of the pipeline.
The developed methodology produces decision models based on the comparison of the predicted pipeline-failure probability with target reliability levels derived by risk analysis. This comparison, together with benefit-to-cost analyses, assists the operator in making maintenance and operational decisions that guarantee safe operation of the pipeline while prioritizing the finite resources to minimize pipeline risk.
Acknowledgments
The authors thank Petróleos Mexicanos for permission to publish results presented here.
References
- Ahammed, M., and Melchers, R.E., "Reliability estimation of pressurized pipelines subject to localized corrosion defects," Int. J. Pres. Vessels & Piping, Vol. 69 (1996), pp. 267-272.
- Pandey, D., "Probabilistic models for condition assessment of oil and gas pipelines," NDT&E International, Vol. 31 (1998), pp. 349-358.
- Ahammed, M., "Probabilistic estimation of remaining life of a pipeline in the presence of active corrosion defects," Int. J. Pres. Vessels & Piping, Vol. 75 (1998), pp. 321-329.
- Turley, R., Johnston, D.C., and Kolovich, C.E., "Probability approach promises enhanced maintenance program," Pipe Line & Gas Industry, Vol. 84 (2001), Online publication.
- International Standard ISO 16708, Reliability based limit state methods, The International Organization for Standardization, Revision No. 02, October 2001.
- API Standard 1160, Managing σystem integrity for hazardous liquid pipelines, American Petroleum Institute, Washington, 2001.
- Caleyo, F., González, J.L., and Hallen, J.M., "A study on the reliability assessment methodology for pipelines with active corrosion defects," Int. J. Pres. Vessels & Piping. Vol. 79 (2002), pp. 77-86.
- Vieth, P.H., "Comprehensive, long term integrity management programs are being developed and implemented to reduce the likelihood of pipeline failures," Corrosion/2002 Plenary Lecture, Mater. Performance; June 2002, pp. 16-22.
- Melchers R.E., Structural reliability: analysis and prediction. UK: Ellis Horwood, Chichester, 1999.
- Zimmerman, T.J.E., and Chen, Q., "Target Reliability Levels for pipeline limit state design," Proc. of the International Pipeline Conference, ASME 1996, Vol. 1, pp. 11-130.
- Sotberg T., Moan, T., Bruschi, R., Jiao, G., and Mørk, K.J., "The SUPERB Project: Recommended Target Safety Levels for Limit State Based Design of Offshore Pipelines," 16th International Conference on Offshore Mechanics and Arctic Engineering, Yokohama, Apr. 13-18, 1997, pp. 71-77.
- Martinez, J.L., and Rodriguez, E., "Tolerable risk criteria for gas transmission pipelines," Pipes & Pipelines International, Vol. 44 (2002), No. 5, pp. 30-36.
- Hallen, J.M., Gonzalez, J.L., Caleyo, F., and Fernandez-Lagos, F., "In-line inspection guides integrity assessment of sour gas," OGJ. Apr. 15, 2002, p. 62.
- ASME-B31G. Manual for determining the remaining strength of corroded pipelines. A supplement to ASME B31G Code for Pressure Piping. New York: ASME, 1991.
- Kiefner, F,. and Vieth, P.H., "New method corrects criterion for evaluating corroded pipe," OGJ. Aug. 6, 1990, p. 56.
The authors

Francisco Caleyo ([email protected]) joined the Pipeline Integrity Assessment Group of IPN in 1999 where he heads a research team involved with the development and application of structural reliability analysis techniques on onshore and offshore pipelines. He holds a BS in physics and an MSc in materials science from Universidad de La Habana, Cuba, and a PhD (2001) in materials science from Universidad Autónoma del Estado de México.

José Manuel Hallen López is a professor of Instituto Politécnico Nacional (IPN), Mexico, and cofounder of the Pipeline Integrity Assessment Group of the IPN. He holds a PhD (1990) in metallurgy by the University of Montreal.

Jorge L. González is a professor at the metallurgy department of the IPN and works in the field of fracture mechanics and pipeline-integrity assessment technologies. He founded and heads the Pipeline Integrity Assessment Group of the IPN. He holds BS and MSc degrees in metallurgy from IPN and a PhD in material science from the University of Connecticut.

Francisco Fernández-Lagos ([email protected]) is maintenance vice-manager at the Gerencia de la Coordinación Técnica Operativa Región Sur, Pemex Exploración y Producción with 19 years' experience in the pipeline industry. He holds a BS in mechanical and electrical engineering from Universidad Veracruzana and an MSc in pipeline-management engineering from Universidad de las Americas, México.