Nelson-Farrar Quarterly Costimating: How refinery fuel indexes have varied
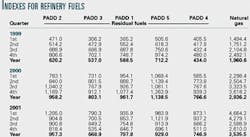
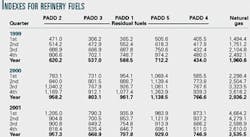
Refinery fuels costs have endured an unsteady course since 1999. As shown in the accompanying table, most of the PADD residual fuels' increases in costs occurred in 1999 and 2000 for all of the five PADD districts. PADD 4 experienced the least variance while PADD 5 incurred the highest variance in price over the period.
The cost for natural gas for refinery usage increased dramatically through 1999 and 2000, and then dropped during 2001. These conclusions are based on costs of an average refinery fuel consisting of 1 bbl each of PADD Districts 1-5 and an average US cost of 4.4 MMscf natural gas (a 1 bbl equivalent on a btu-content basis). Raw residual fuel oil and natural gas prices come from publications put out by the US Department of Labor. Biggest variations occurred in PADDs 2, 3, and 5. PADD 4 increased over the period in yearly average from 434.0 to 766.6.
PADD 1's 3-year averages started with 588.5, increased to 961.7, and declined to 797.8. All indexes shown are based on 1956 = 100, the basis of the Nelson-Farrar Operating Index for an average US refinery.


