Demand, supply will determine when world oil output peaks
Projecting the availability and cost of oil 20-40 years out is an important but uncertain task.
Periodically various authors project a significant shortfall of oil availability within a few years. A recent example is a March 1998 "Scientific American" article by Campbell and Laherrere.1 Professional journals have also published this information as cited in the article.
The authors suggest that OPEC overestimated its reserves by a significant amount beginning in the late 1980s, and they note the falling rate of worldwide oil discovery.
The purpose of this article is to view these observations from a somewhat different perspective.
A unifying theme in these discussions is the frequently observed exponential rise and fall of the rate at which a natural resource is consumed. M. King Hubbert has detailed this observation.2 The graph of consumption rate versus time has become known as the Hubbert curve. Another theme is the constant price of oil when averaged over a long period.
This article will show that historic production rate data are inadequate to predict a future peak in oil production. Demand and supply determine the rate of oil production, until at some distant point supply (availability) will ultimately determine it.
Exponential growth
Exponential growth of a quantity Q is a common concept applied to many activities. It simply states that the growth rate is proportional to the amount of the material already present or utilized, as shown in the following rate and integrated equations:
null
This concept is true for compounded interest. The two equations may be regarded as continuously compounded interest, in contrast to discrete-period compounding, as normally used in business transactions.3
The exponential concept is also true for growth of microbes when unconstrained by space, nutrients, or toxins. In the microbiology literature it is referred to as the log-growth phase. The two equations require only two parameters, an initial amount or concentration, Qstart, and a growth rate constant, r.
It is another matter to state that the rate of natural resource consumption is proportional to the amount of that resource previously consumed. This statement is one assumption of the Hubbert curve.
Empirically exponential growth has been shown to be true in the early stages of consuming a natural resource. Several supporting statements could be made that are consistent with this empirical observation of an exponential increase in consumption rate, including:
- "Consumption of the resource itself builds the infrastructure that results in increased consumption of the resource."
- "New technologies build on past technologies."
- "New technologies spread from their place and time of origin in an apparent exponential fashion."
No matter the rationale about exponentially increasing natural resource consumption rates, they are empirical observations, not a result of mathematics, as in the case of "interest plus principal" or numbers of microbes per cubic centimeter.
Growth limits
Sustained exponential growth does not exist in physically realizable circumstances. There are real world constraints. For this reason, constraints must be added to the two equations for the equations to be useful in the real world.
In the case of microbial growth, the constraint is frequently depletion of a particular nutrient or its limiting rate of supply, such as access to oxygen. In other circumstances, the exponential growth phase is constrained by accumulation of a toxin. These constraints can be given a mathematical form and have been experimentally verified.4
For the consumption of nonrenewable resources, constraints to exponential growth must exist, but these constraints are more difficult to demonstrate experimentally.
The ultimate constraint on exponential consumption rate increases is the amount of the resource that is economically available for use in a particular circumstance.
Another constraint on the rate of resource consumption is just the demand for a particular resource. This demand constraint applies to resources available in very large amounts, such as sand and salt. For the medium term, this demand constraint also applies to coal and lignite production rates.
The great convenience of oil as a source of both energy and petrochemicals makes the medium-term constraint on oil production rates the amount of the resource that is ultimately available. This situation is in contrast to the present short-term situation, where the supply exceeds demand for oil.
The medium and long-term constraint for oil production is the amount of the resource that is ultimately available, as limited by economics and technologies. This amount has been termed Q∞. Before Edwin Drake drilled the oil well at Titusville, Pa., in 1859, Q∞ for oil was essentially zero.
This Q∞-achievable is a function of technologies available to recover the resource and a function of geology. For this reason, the Q∞-achievable increases as technology develops. At the turn of the 20th century people would never have considered drilling to 20,000 ft or in more than 3,000 ft of water.
Q∞-achievable is considerably less than the absolute amount of a resource that exists on the planet. We will define several Q∞s in this article.
Given an estimate of the Q∞-achievable, now matter how uncertain, this limit on oil availability must be included in the production rate equation. No theoretical way exists to include this available quantity in the oil production rate equation, so a simple function will be used in the following equation:
null
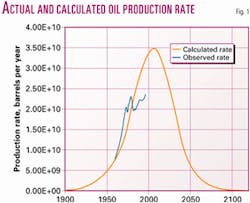
In this equation, the term in parentheses starts at a value of 1 and decreases asymptotically to zero as the resource is consumed. By this means, resource consumption is mathematically limited to the amount of the resource available, and an apparent exponential decay in production rate is observed (Fig. 1).
The area under the Hubbert curve in Fig. 1 is the numerical value of Q∞ used to plot the curve. Other more complicated constraints could be included in the rate equation if desired. More complicated functions are not justified with the limited amount of data available.
Oil production
Now we fit this rate equation to a tabulation of cumulative world oil production 1919-94,5 and world production rates 1960-96.6
Many procedures could be used to find the constants in Equation 3 to these two sets of data. Obviously, the equation can be integrated analytically, but I choose graphical integration to maintain the real physical nature of the constants in the immediate view of the user. I choose to use an Excel spreadsheet to tabulate the data by year and then to use the "Solver Function" to determine the numerical values for the three constants:
I choose to minimize the sum of the square of difference between the predicted value and the tabulated value in determining these constants.
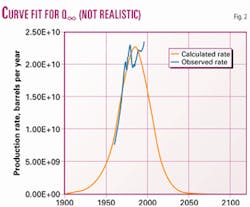
When the Excel Solver is used to determine all three constants based on the two oil production data sets, the result (Fig. 2) is not realistic. Oil production did not peak in 1985 at 22 million b/d.
Historic oil production rates are not adequate to predict future production rates, at this time, as clearly demonstrated (Fig. 2). An independent estimate of Q∞-achievable is essential because the computer-generated estimate used for Fig. 2, 1.10 x 10¹² bbl, is unreasonable.
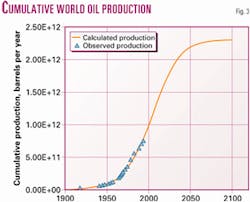
A value of 2.3 x 10¹² bbl will be used for Figs. 1 and 3. This value is consistent with Fig. 12 of Porter.7
Fig. 1 shows the impossibility of fitting events, such as the oil production slump that resulted from the OPEC embargo, with a simple three-parameter equation covering a 200-year span. The cumulative production plot (Fig. 3) smoothes out the embargo situation.
Fig. 1 also points toward a peak in world oil production in 2005 at 34 billion bbl/year. Oil production predictions in Figs. 1 and 3 employ three constants. They are the assumed Q∞-achievable of 2.3 x 10¹² bbl plus two additional constants as determined by the curve-fitting process:
- Hypothetical cumulative oil production in 1900 of 4.55 billion bbl.
- Growth rate term of 0.0604 fraction/year.
In these calculations the constraint on production rate caused by Q∞-achievable is being noted even while oil production rates are still increasing. For example in 1994, the last cumulative world production rate data used in the correlation, the production rate restraining term, (1-Q/Q∞-achievable) has a value of 0.664. This quantity is named the restraining factor in the production rate equation.
Note the vast extrapolation of a limited amount of data (Fig. 1). The moderate restraint on exponential growth already experienced allows the whole projection that is shown.
Different authors make different choices for Q∞-achievable. For example, Campbell's recent choice is lower, 1.7, not 2.3 x 10¹² bbl, and it is the source of discussion today. His logic for the lower value considers the numerical difference between the oil finding rate and production rate.
Since the current finding rate is lower than the production rate, he made an extrapolation as to when we should "run out of oil" and an appropriate Q∞-achievable determined. There is little rationale for difference taking between oil finding rate and production rate. It does not make economic sense to find oil today that will not be needed for 20 or more years for the international industry as a whole. We have a 44-year supply of oil at the present rate of use.8 Oil exploration and new production activities depend today on perceived local exceptions to the global oil supply-demand situation.
Campbell noted that this difference-taking procedure is consistent with historic domestic oil finding and production rates. To meet domestic requirements, the choice is to import more oil. Domestic oil resources remain to be used, but few are economically competitive with imported oil. With regard to the whole world, there is no option to import more oil.
Constant price
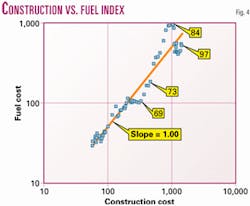
Relative to industrial construction costs, oil prices have remained constant for the past 70 years. This can be shown by using the refinery construction cost index and refinery fuel cost index as published in OGJ. The OGJ staff extrapolated these costs back to 1930.
Other choices of fuel cost and industrial construction cost indices could have been made, and they would have yielded similar results.
Least-squares fitting of these data results in a slope of 1.0 (Fig. 4). This one-to-one relationship between fuel cost and industrial construction costs exists for the entire period as a whole.
There is a significant price perturbation, as an apparent result of the OPEC oil embargo, which began in October 1973. It should be stressed, however, that the real price of oil had started to increase earlier, after 1969 (Fig. 4). In 1984 it would have appeared that the price of oil relative to industrial construction cost had increased permanently, but not so. The price of energy fell in 1985 and remains low relative to industrial construction costs.
The actual oil production rate data used in Figs. 1 and 3 were taken during this long period of relatively constant oil prices, as discussed above. As a result, that assumption of constant relative oil price is a part of its extrapolation from 1996 to 2010. Adequate oil producing capacity has been maintained in spite of producing oil from more extreme circumstances. This fact has come as a surprise to the oil industry, and it has been explained as being the result of improved exploration and production technologies. This circumstance has been discussed recently for domestic oil reserves.9 10
At some point the real price of oil will have to increase with respect to industrial construction costs. The straight line (Fig. 4) will not continue forever.
Predicting when this real price increase for oil will occur is very difficult. Oil exploration and production technology improve in unpredictable ways. Increased oil prices will boost industrial construction costs.
Increasing prices
A rise in the price of oil relative to industrial construction costs will evoke several responses. Some responses will sustain the rate at which oil can be produced:
- Application of significantly more expensive exploration and production technologies.
- Application of advanced enhanced oil recovery (EOR) processes.
- Major increases in the production of heavy oil.
Application of more expensive E&P technologies: At relatively constant oil prices the technologies for exploration and production of oil have improved to an extent that was not expected.
We have sustained the success of exploratory wells, demonstrated the capabilities to produce oil in hostile environments, and further improved the fraction of oil produced before field abandonment.
Real increased oil prices, or even a confident expectation of increased prices, will result in further improvements in oil exploration and production technologies.
Application of advanced EOR processes: Sophisticated EOR processes have been developed in laboratory and field-tested to a limited degree. These technologies include surfactants, in situ combustion, microbial, caustic and alcohol flooding, and others. Some of these technologies may become attractive with increased oil prices. Present-day EOR techniques can be further improved and applied in circumstances that are not now economic when there is a real increase in oil prices.
Major increases in production of heavy oil: Most estimates of oil availability are for conventional oil and so exclude heavy crudes and tars. This is true of the Q∞-at-a-constant-price used in Figs. 1 and 3 of 2.3 x 10¹² bbl. Tars and heavy oils are estimated to total a similar volume. Tar and heavy crudes are produced in Canada, Venezuela, and other countries.
Other responses to increased oil prices will moderate the demand for oil:
- Increased liquid fuel yields at refineries.
- Alternatives to liquid hydrocarbon fuels.
- Displacement of liquid fuels from stationary usage to transportation usage.
- Reduced transportation fuel requirements by consumers.
Increased liquid fuel yields at refineries: Refinery configurations and operating conditions are adjusted to minimize the production costs of their primary product, transportation fuels.
Low oil prices have resulted in extensive usage of processes such as coking. Much of the resulting coke has only boiler fuel value.
Refinery upgrades now frequently include the sale of electric power as a byproduct. This circumstance results in the underutilization of the organic carbon from oil.
With significant increases in oil prices, processes such as hydrocracking will become favored, resulting in increased transportation fuel yields.
If natural gas prices rise in parallel with oil prices, gasification of coal to supply hydrogen and energy to refineries will be justified. In that circumstance, a refinery might produce a larger volume of transportation fuels than it purchases as crude oil. These changes in refinery configurations and operating conditions will occur gradually, without great notice by the public.
Increased prices for conventional oil will also justify the more expensive processing of very abundant heavy, sour crudes. Until many of these options for increased refinery yields have been implemented, there is little incentive to extensively develop nonoil sources of liquid hydrocarbons.
Displacement of liquid fuels from stationary uses: For stationary usage, natural gas is the fuel of choice. Where a distribution infrastructure for gas is available, there is little reason to consider any other fuel for stationary use. In cases where 100% reliability is essential, liquid fuel backup may be required. It should be noted that delivery of natural gas is frequently more reliable than either water or electricity.
Liquid fuels are then used for stationary uses in circumstances where natural gas distribution networks are not available. This usage of liquid fuels for heating is considerable in older metropolitan areas where gas lines are costly to install and in rural areas where the population density does not justify the cost of a gas distribution network.
Propane is an example of the displacement of liquid fuels from stationary uses to transportation usage. The amount of propane that is available relative to the total domestic transportation fuel consumption is limited. With propane being defined as an alternative fuel, its usage for transportation can be expected to increase, leaving less propane available for stationary usage, largely in rural areas.
The decision then becomes a political issue with advocates of nonhydrocarbon fuels and rural consumers joining against the extensive use of propane as an alternative transportation fuel. The US General Accounting Office has determined that propane availability and price will not be short-term problems.11 The conflict among users does not exist between diesel transportation fuels and light fuel oil since diesel and fuel oil are primary refinery products. Increased prices for fuel oil and diesel will discourage their use in stationary applications.
Displacement of natural gas and liquid fuels by solid fuels for stationary use is not a probable activity because liquid fuels offer many advantages over solid fuels. Some of these advantages for liquids and gaseous fuels over solid fuels are as follows:
- Lower investment and maintenance requirements by the user.
- Much greater consumer convenience.
- Less difficulty in meeting emissions standards.
The availability of free solid fuel is inadequate to cause significant use of solid fuels on a small or even a medium scale. Municipal incinerators and recycling operations have to charge a tipping fee. This number, frequently $15-25/ton, quantifies the actual negative value of municipal solid waste as a fuel relative to fossil energy. Sawmills and paper mills are exceptions to this usage of solid fuels.
In many cases, the substitution of solid fuels for liquid fuels in stationary applications is best accomplished indirectly, via the use of electricity. Coal can be burned to produce electricity economically in an environmentally acceptable manner. The electricity is then available as needed for heating, cooling, and mechanical power. Solar, wind, nuclear, and geothermal are also options for production of electricity. Currently gas and cogeneration facilities are the least costly source for incremental electric power generation capacity.
Reduced transportation fuel requirements by consumers: Reducing transportation fuel requirements requires changes in life style. Such changes come very slowly to the American public absent regulatory constraints. Many people regard increased transportation fuel costs as just an increase in the cost of living, not as a reason to reduce transportation fuel usage.
Q∞ with competition
Nonpetroleum sources of hydrocarbon liquids will become more attractive as the real cost of oil increases.
Conversion of natural gas to liquid fuels may be the next source of liquid fuels, particularly for natural gas in remote locations. Shell is already accomplishing this conversion, and other companies such as Exxon are considering the opportunities.12
If and when gas prices rise in parallel with oil, other fossil fuels will become attractive sources of liquid fuels. South Africa has demonstrated gasification of coal followed by Fischer-Tropsch synthesis of liquids. Tennessee Eastman is gasifying coal for production of "petrochemicals" at Kingsport, Tenn.
Synthesis gas, from gasification of coal and-or reforming natural gas, provides options for two nonhydrocarbon fuels, methanol and dimethyl ether. Pyrolysis of coal to recover hydrocarbon liquids prior to the combustion of the residual char for generation of electric power is another potential source of hydrocarbon liquids.13
Several other coal liquefaction processes have been developed. Oil shale is a very large resource of liquid hydrocarbons that may prove difficult to implement due to environmental constraints.
Significant increases in oil prices and-or international political unrest will make some of these technologies for nonpetroleum liquid fuels attractive. At some point in the future, liquid fuel needs will be most economically supplied by these nonpetroleum sources. This competition with alternative fuels will place an upper bound on oil prices. Oil production rates will decrease rapidly when this limiting price for oil is reached. The decreased production rates will not mean we have run out of oil on Earth. It will mean that we have run out of oil that is price competitive with nonpetroleum sources of liquid fuels.
Drawing conclusions
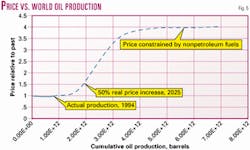
An independent assumption of the volume of economically available oil is essential. Several of these Q∞s have been considered in this study and have resulted in several cost regimes for oil production (Fig. 5). This curve is extrapolated after 1994.
The amount of oil available is a complex function of geology, international politics, and improved technology. Therefore it is almost impossible to predict when oil's true price will increase. When it increases, the Q∞-at-constant-prices will largely have been consumed. This quantity is the 2.3 x 10¹² bbl used in Figs. 1 and 3.
After that oil will be produced at increasing prices, justifying more expensive E&P technologies, but this rising price circumstance cannot continue indefinitely.
When the price approaches that of alternative fuels, the oil in Q∞-with-rising-prices will largely have been produced. That quantity cannot be extrapolated from existing data, but it is guessed to be half of Q∞-at-constant-prices, or 1.65 x 10¹² bbl for Fig. 5. This Q∞-with-rising-prices is a function of the several factors of geology, etc., plus an additional factor, the price of alternative fuels, also difficult to predict. A previous paper details some of the considerations.14 Without great confidence I suggest that price as 2 to 5 times the present relative price of oil as the price at which large amounts of alternative liquid fuels will be available from solid fossil fuel resources such as coal and oil shale. A value of 4 times present price is used in Fig. 5.
When cost-competitive alternate fuels become available, world oil production rates will fall since more expensive E&P methods will no longer be justified. This observation regarding declining oil production rates suggests that Q∞-with-competition is a strong function of alternative liquid fuels costs as well as geology and technology.
Q∞-with-competition, even more difficult to estimate than Q∞-with-rising-prices, is guessed at half the value of Q∞-at-constant price, or 1.65 x 10¹² bbl for Fig. 5. The X-axis is cumulative production, not time.
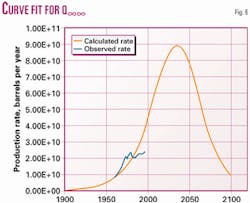
Demand and availability will determine the production rate until such time as availability will determine it, at some distant point, perhaps 40 years from now (Fig. 6). For this figure, Q∞∞ is the sum of the three Q∞s discussed in this section, plus heavy oil, for a total of 6.9 x 10¹² bbl.
References
- Campbell, C.J., and Laherrere, J.H., "The End of Cheap Oil," Scientific American, March 1998, pp. 78-83.
- Hubbert, M.K., "Survey of World Energy Resources," Canadian Mining and Metallurgical Bull., July 1973, pp. 37-53.
- Jelen, F.C., "Cost and Optimization Engineering," McGraw-Hill, New York, 1970, Ch. 4, p. 64.
- Bailey, J.W., and Ollis, D.V., "Biochemical Engineering Fundamentals," Second Edition, McGraw-Hill, New York, 1986, pp. 397-400.
- Porter, E.D., "Are We Running Out of Oil?," Discussion Paper #081, Table 4, Policy Analysis and Strategic Planning Department, API, Washington, DC, December 1995.
- Anon., "Annual Energy Review," Table 11.5, US Energy Information Agency (www.eia.doe.gov), May 1988.
- Porter, E.D., "Are We Running Out of Oil?," Discussion Paper #081, Fig. 12, Policy Analysis and Strategic Planning Department, API, Washington, DC, December 1995.
- Porter, E.D., "Are We Running Out of Oil?," Discussion Paper #081, Fig. 2, Policy Analysis and Strategic Planning Department, API, Washington, DC, December 1995.
- Nehring, R., "Knowledge, Technology Improvements Boosting US Upstream Opportunities," OGJ, Nov. 2, 1998, pp. 94-98.
- Nehring, R., "Innovation Overpowering Reserves Depletion in US," OGJ, Nov. 9, 1998, pp. 87-90.
- Anon, "Auto Fleet Law Not Likely to Spike Propane Prices," OGJ, Oct. 5, 1998, p. 35).
- Corke, M.J., "GTL Technologies Focus on Lowering Costs," OGJ, Sept. 21, 1998, pp. 71-77, and Sept. 28, 1998, pp. 97-101.
- Parker, H.W., "Liquid Synfuels Via Pyrolysis of Coal in Association with Electric Power Generation," Energy Progress, March 1982, pp. 4-8.
- Parker, H.W., "Process Design as a Research Tool," Today's Chemist at Work, Vol. 4, No. 11, pp. 26-30, The American Chemical Society, December 1995.
The author
Harry W. Parker ([email protected]) has been involved in energy related research at many levels, including in positions with Phillips Petroleum Co. and Washington, DC, research organizations. He has been associate and full professor in the Texas Tech University Department of Chemical Engineering since 1970. He holds degrees from Texas Tech University and Northwestern University.
Correction
Errors appeared in a table, "A 30 year record of US well completions" (OGJ, Jan. 28, 2002, p. 86).
Total wells and total exploratory wells figures for 2002 and 2001 were reversed in the table. The correct estimates, to correspond with the accompanying text, are 28,000 total wells and 5,623 exploratory wells for 2002 and 36,990 total wells and 6,825 exploratory wells for 2001.
The 1996 total well count should have been 24,948.


