Canadian liquids system recounts experience with crack-detection ILI tools
Since 1993, Enbridge Pipelines Inc., Edmonton, has been conducting crack inspections with in-line tools on its liquids pipeline system. As part of its ongoing integrity- management program, the company has inspected or will inspect its more than 15,000 km of pipeline.
The extensive program has consisted of mature metal-loss and geometry inspection as well as crack inspection using the most sophisticated in-line inspection (ILI) tools available. Reported here are the results and conclusions to date for overlapping crack inspection data analysis from three crack-detection tools.
In September 1993, Enbridge conducted its first ultrasonic crack inspection with British Gas' Elastic Wave Vehicle (now GE Power Systems Oil & Gas PII Pipeline Solutions) on a Canadian portion of its 864 mm (34-in.) OD line. The Elastic Wave Vehicle was also used for crack detection on additional segments of this same 34-in. line during 1994, 1995, and 1996.
Then in November 1997, Enbridge conducted its first crack inspection with Pipetronix's UltraScan CD tool (now also part of GE Power Systems Oil & Gas PII Pipeline Solutions) on a segment of this 34-in. line that was previously inspected with the Elastic Wave Vehicle. The UltraScan CD tool was then used again in 1999, 2000, and 2001 to complete crack inspection of the Canadian portion of the 34-in. line.
In December 1998, Enbridge conducted its first magnetic crack inspection with the PII TranScan (TFI) circumferential magnetic inspection tool on a US portion of another 34-in. line. This same section of line was subsequently inspected with the PII UltraScan CD tool in July 2001.
Based on these activities, Enbridge considers the best in-line crack-detection technology available within the market today to be GE Power Systems Oil & Gas PII Pipeline Solutions' UltraScan CD tool, a conclusion justified by its higher sensitivity to cracking issues within a pipeline, as discussed presently.
As the Enbridge crack-detection program matures and yields further knowledge about pipeline cracking along with improvements to crack-detection technologies, the optimum choice of crack-detection tool, both technically and economically, will be evaluated for the Enbridge crack-detection program.
Beginnings
Enbridge established the need for an ILI crack-detection program in 1990 in discussions of developing crack-detection tools with potential vendors following a crack-related failure in 1989. In 1991, the debate of a hydrotest vs. inspection was again visited, with inspection being the recommended option.
A nondestructive test such as an ILI crack-tool inspection is preferred over a destructive test such as a hydrotest. Although a hydrotest will ensure detection of critical crack flaws, there is concern of crack growth of non-critical flaws that would not fail during the test and therefore remain in service after completion of the hydrotest.
Later in 1991, British Gas proposed testing the Elastic Wave Vehicle for feasibility, modification, and prototype inspection. In 1992, Enbridge (IPL at that time) and Colonial Pipeline Co., Atlanta, formed an informal joint venture to assess the potential of various crack-detection technologies with the intent to support a crack-detection developer.
Several vendors were approached and investigated. Enbridge and Colonial signed an agreement with British Gas for development of a modified elastic-wave vehicle complete with test inspection. In September 1993, the prototype elastic-wave vehicle was launched on the Enbridge pipeline system, thereby initiating Enbridge Pipelines' crack-detection program.
EW program
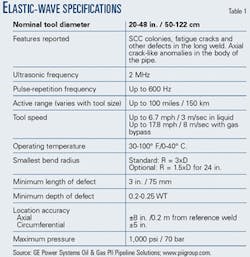
The Elastic Wave Vehicle (Fig. 1) is an ultrasonic crack-detection tool. The Mk III Elastic Wave Vehicle has up to 96 ultrasonic sensors mounted within liquid-filled wheels permitting transmission of the ultrasonic signal into the pipe wall whether running in a liquid or gas pipeline. The Mk III Elastic Wave Vehicle has an active range up to 150 km.
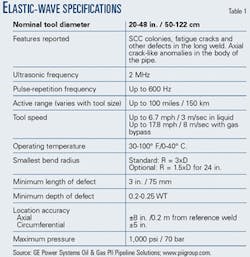
The initial Enbridge crack inspections used a preceding, similar model (Mark II) of the Elastic Wave Vehicle that was capable of inspection distances of up to only 45 km. Table 1 illustrates the specifications for the most recent Elastic Wave Vehicle (Mk III).
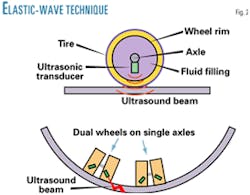
The ultrasonic signals identify features from the side due to a reflected echo pulse. The ultrasonic transducers transmit an ultrasonic beam through liquid-filled wheels and into the pipe wall at a 65° angle. A staggered sensor array transmits in both clockwise and counter clockwise directions enabling full-body coverage as well as focusing on the longitudinal-weld-seam area.
This tool was designed for detecting pipe body and seam-weld features, specifically targeting long-seam cracking and stress corrosion cracking (SCC). Fig. 2 demonstrates the elastic-wave technique.
The initial elastic wave crack inspection was conducted on 42 km of 34-in. pipeline in 1993. The elastic wave crack-inspection program continued in 1994 with another 63 km, in 1995 with another 90 km, and in 1996 with another 120 km.
Several inspections were performed to complete these inspected distances. All inspections occurred within a similar section of this same 34-in. pipeline with the Mark II Elastic Wave Vehicle.
This vehicle has also been used extensively within the Enbridge Energy Partners (formerly Lakehead) US portion of this same 34-in. pipeline. From 1995 through 2000, approximately 500 km of this line have been inspected for cracking using either the Mark II or Interim Mark III Elastic Wave Vehicle.
UltraScan CD program
The UltraScan CD tool (Fig. 3) is also an ultrasonic crack-detection tool. Similar to the Elastic Wave Vehicle, it also identifies features from the side due to reflected ultrasonic signals. This tool requires a liquid couplant to allow the transmitted ultrasonic signal to enter into and return from the pipe wall.
The UltraScan CD tool transmits ultrasonic signals that enter the pipe wall at a 45° angle. Each sensor utilizes a two-skip response to detect pipeline features. The 34-in. UltraScan CD inspection tool used by Enbridge has 480 45° shear-wave transducers and 32 longitudinal transducers. An offset sensor skid has 480 transducers that transmit ultrasonic signals in both the clockwise and counter clockwise directions to enable description of a feature from both sides.
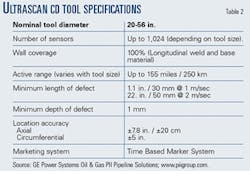
This tool can detect and identify both pipe body and long-seam features, specializing in long-seam cracking and SCC. There are 32 wall measurement sensors for assessing wall loss to a limited degree. Table 2 describes the UltraScan CD tool's specifications.
The tool was first launched in 1997 to perform a crack inspection on 283 km of 34-in. line. This is the same pipeline that had been previously inspected with the Elastic Wave Vehicle but within a different section. In 1999, 255 km of the same section that had previously been inspected with the Elastic Wave Vehicle was inspected with the UltraScan CD tool.
At the end of 2000, another large crack-inspection program was completed for a total of 704 km of the same pipeline. This completed crack inspections for 100% (1,242 km) of the entire Canadian portion of the 34-in. pipeline. Ongoing data analysis and field excavations were progressing. A discussion of the results follows presently.
Based upon engineering and risk assessment, a continuation of the crack-detection program proceeded into 2001 for two other pipelines within the Enbridge system throughout Canada and the US.
A total of 383 km of another 34-in. pipeline in the US were inspected and data gathered. In addition, 806 km of crack data were being gathered on a 24 and 26 in. pipeline within both Canada and the US.
Engineering assessment of the results from these inspections is continuing to determine the need for further crack inspections of these lines. In 2002, crack inspection of a 20-in. pipeline in Eastern Canada has taken place.
This is the first time a 20-in. UltraScan CD tool is available to perform a crack inspection. This inspection will cover 211 km of pipeline.
Ongoing analysis is being performed to assess the status of cracking within this line.
TFI inspection
The TransScan (TFI) tool (Fig. 4) is a magnetic flux leakage (MFL) tool with the magnetic circuit oriented in the circumferential position, thus making it sensitive to axial features. The tool measures deviations to the magnetic flux lines as these lines of flux are disturbed from their normal path due to a pipe-wall anomaly.
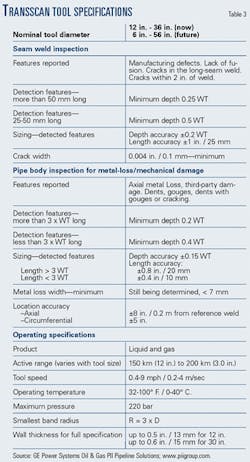
Table 3 presents specifications for the TranScan. (Note the specification for both long-seam cracking and metal loss.)
The TFI tool was first introduced in 1996 by British Gas (now GE Power Systems Oil & Gas PII Pipeline Solutions) as a means to identify and manage narrow axial external corrosion (NAEC) due to the inability of conventional MFL tools to identify this type of corrosion. The first launch of the TranScan tool occurred on an Enbridge pipeline that was susceptible to the NAEC phenomenon.
After use to examine NAEC, the tool showed itself able to identify certain types of long-seam features. A second generation of the TFI tool was constructed which focused on making the tool more sensitive to the type of features that could be encountered at or within the long seam.
After the initial NAEC inspection with the TFI tool in 1996 and the modifications to the first generation TFI tool, Lakehead Pipelines (now Enbridge Energy Partners), a sister company to Enbridge, ran the TFI tool in a pipeline in the US at the end of 1998. The pipeline that was inspected had experienced a hook-crack failure in 1995.
The TFI tool was chosen to perform a crack inspection, it being judged to be the appropriate tool for the type of defect being sought. The program inspected a limited range of the pipeline (72 km) considered susceptible to this crack failure.
UltraScan CD vs. TFI
From the 1998 TFI inspection and 2001 UltraScan CD inspection of a 34 in. Enbridge Energy Partners pipeline, there are 20 km of crack data that overlap from each inspection available to compare at the time of this writing. This 34-in., 359 MPa (52,000 psi) yield strength pipeline was built in 1968. It is entirely coated with Polyken tape and very similar in design to the other 34 in. pipeline within the Enbridge system that has primarily been the focus of the Enbridge crack-detection program.
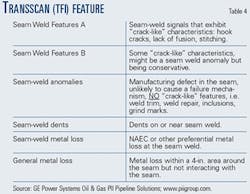
The first requirement of understanding and comparing data sets is how to interpret the data to ensure the same types of features are being compared due to differing feature descriptions from each tool. The results from the TFI report at that time were classified as shown in Table 4.
The TFI results indicated no seam weld Features A or B and therefore no assessment of "crack-like" features within the entire inspected section. Within the 20-km overlap section, the TFI tool identified 147 seam-weld anomalies and 70 seam weld metal-loss locations.
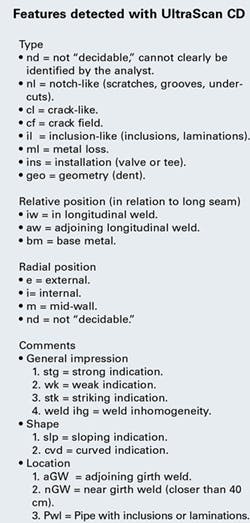
The results generated from the UltraScan CD tool appear with much more detail because of the tool's ability to provide more in-depth information about each feature, described in the accompanying box. In 20 km of overlapping data, there were very few—only 12—reportable features identified by the UltraScan CD tool. These were primarily classified as "inclusion-like" or "notch-like" "adjoining longitudinal weld."
These minimal UltraScan CD data were compared to TFI data. There were no distinct matches or misses observed. The most important factor was that neither tool reported any cracking issues within this common 20-km section.
The comparison of the common data sets for both the UltraScan CD and TFI tools was interesting and insightful. The limited use of the TFI tool within the Enbridge system has not allowed extensive exposure to TFI tool results and therefore not built the same level of confidence as with UltraScan CD tool results.
Although there have been no situations within this inspected section to cause concern about results from the TFI tool, there are limitations with magnetics and crack sizing that must be considered. Sizing of very tight cracks or features using magnetics, such as with the TFI tool, may not be possible.
Magnetics require an air gap, or loss or opening of metal, within steel to cause magnetic lines of flux to "leak" and therefore be measured by a sensor, thus representing the feature. In situations in which a crack is very tight (fatigue cracking, for example), the magnetic flux is shunted and passes through the tight feature, thereby not identifying or inaccurately measuring the dimensions of the particular feature.
There are distinct differences between the technologies of ultrasonics and magnetics. Ultrasonics is a direct measurement of a reflected signal. Magnetics is an inferred measurement due to the rate of change of the magnetic lines of flux.
In a controlled laboratory setting, ultrasonic technology is a superior measurement method. Pipeline inspections, however, are far from a controlled environment. Cleanliness, product specifications, and line rates have affect ultrasonic inspections.
Achieving optimum results from an ultrasonic inspection requires these variables to be managed and controlled. When these variables cannot be controlled, a magnetic tool is a more robust choice.
When line cleanliness and speed are effectively controlled, the UltraScan CD tool is more sensitive than the TFI tool. The CD tool has many more sensors than the TFI tool. The resolution of the CD tool allows for much better feature detection and discrimination than the TFI tool.
Enbridge did encounter situations in which the TFI tool observed NAEC along the long seam of a tape-coated line.
In one respect, this is a useful detection, but when the search is specifically for cracks within the long-seam weld, the strong signal generated from the NAEC feature masks any potential cracking features within the weld.
For this reason Enbridge has concerns using a TFI tool to inspect for long-seam cracking on a tape-coated line.
If the type of cracking within a line is suitable for the TFI tool to detect, such as hook cracks or lack of fusion, then the TFI tool is a more economic solution for the inspection. If the type of cracking is incompletely understood and there is a potential for very tight cracks such as fatigue cracking within the long-seam weld, then the CD tool is a more appropriate choice.
The UltraScan CD tool is more expensive to run than the TFI tool. Increased feature detection and discrimination can justify this increased cost for inspection that uses the CD tool. This increased feature discrimination can also aid in economic efficiencies gained through a well-organized, defined excavation program due to increased feature selection criteria.
Use of the UltraScan CD tool is more prevalent than the TFI tool within the Enbridge crack-detection program. The TFI tool has a place within the crack-inspection program but will only be utilized for known cracking scenarios such as hook crack or other cracking with a larger "gap" to allow for flux leakage and accurate detection.
Even though Enbridge has conducted many crack inspections, the crack-inspection program is quite emergent relative to metal loss and geometry inspections.
There are certain Enbridge lines that are more susceptible to cracking than others, proven through past failures and engineering assessments. These lines are the focus of the Enbridge crack-detection program.
In the future, other less susceptible lines may be deemed to require crack inspection as well. The Enbridge approach to crack inspection of these lines will be to use the UltraScan CD tool unless the full extent of the cracking issue is understood and determined to be appropriate for a tool such as the TFI tool to be utilized.
UltraScan CD vs. elastic wave
The elastic wave and UltraScan CD tools are both ultrasonic crack inspection, internal inspection tools. The UltraScan CD tool is designed for only performing crack inspections within a liquid medium. The Elastic Wave Vehicle can inspect in both a liquid and a gas.
Inspection speed must be controlled for an ultrasonic inspection. For optimum results, the UltraScan CD tool must be run at a speed of 1 m/sec but will still provide accurate results up to 2 m/sec. This increase in speed is a trade off at the expense of the minimum detection limit.
The Elastic Wave Vehicle is more robust in terms of inspection speed. It can successfully inspect in a liquid up to a speed of 3 m/sec. It can successfully inspect in a gas medium up to a speed of 8 m/sec, using gas bypass speed control.
The Elastic Wave Vehicle design houses its sensors within liquid-filled wheels that allow the ultrasonic signal to be coupled to the pipe wall, thereby allowing inspection within both a liquid and a gas.
Enbridge has experienced occasional problems with these liquid-filled wheels tearing on welds or other rough edges within a pipeline. This tear allows the liquid within the wheel to escape, thereby losing the couplant that allows the ultrasonic signal to get to and from the pipe wall. This sensor then becomes non-operational and decreases the data captured from the inspection.
The Elastic Wave Vehicle has three to four times fewer sensors than the UltraScan CD tool and therefore cannot afford to lose operation of one of the sensors. A feature detected by two elastic-wave sensors would be seen by up to eight sensors with the UltraScan CD tool.
This increased detection from multiple sensors allows more detailed description of the feature identified. The minimum detection limit of the UltraScan CD tool is 1mm deep and 30 mm long features. The detection limit of the Elastic Wave Vehicle is approximately 1.6 mm deep and 75 mm long.
As indicated, although both of these tools are ultrasonic crack-inspection tools, there are some distinct differences.
The 1996 elastic-wave inspection collected data for 120 km of 34-in. pipeline. The 1999 UltraScan CD inspection collected 255 km of 34-in. within the same section. Therefore, there are 120 km of overlapping data for comparison. This Canadian 34-in. line is a 359 MPa (52,000 psi) yield strength, Polyken tape-coated line constructed in 1965, 1966, and 1967.
The 1996 elastic-wave inspection identified 73 sites for excavation and assessment. Of these, 18 locations required pressure-containment sleeves as the appropriate form of repair. The most severe defect was a 40% through-wall, 25 mm long manufacturing shrinkage crack along the center line internal surface of the long seam.
Of the remaining 17 sleeve locations, there were 13 other crack features all less than 35% through-wall thickness. The remaining 4 sleeve locations were not crack-like but deemed to require a sleeve as the appropriate form of repair during assessment.
Upon completion of the assessment, 55 locations required recoating. No indications were found at 5 of the 55 locations. The remaining 50 locations were primarily either cold laps of the long seam or irregular trim or grinding around the long seam.
A 1999 long-seam failure, of a section previously inspected by the elastic-wave tool, supported the deployment of an UltraScan CD tool inspection due to uncertainty with elastic-wave results. Further testing of the elastic-wave tool would be carried out to re-establish confidence with elastic-wave results.
The failed section of 34-in. pipeline that was removed, as a result of repair for this long-seam failure, had remaining crack indications within the long seam that had not been destroyed as a result of the failure. Along with these remaining crack indications additional crack-like features of precise dimensions were machined into locations along the long seam to be included within the elastic wave pull-through tests.
The pipe joint that experienced the in-service failure had a very narrow corrosion groove at the toe of the submerged-arc welded (SAW) long seam. This occurrence was unique in that it extended the entire length of the joint. This would play an important role in the results from the pull-through tests.
The pull-through test joints were re- coated with a tape similar to the original installation and the test spool was then set-up for elastic wave pull-through tests.
The testing was successful at identifying the features but also provided additional insight into the capabilities of the elastic-wave tool.
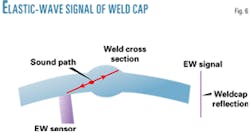
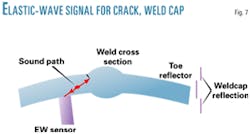
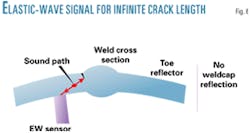
Fig. 5 displays typical elastic-wave data. Figs. 6, 7, and 8 demonstrate the effect on elastic-wave data as a result of both a finite and infinite crack-like feature (or very narrow corrosion groove) at the toe of a long seam.
The infinite crack-like scenario demonstrated the concern for long seam crack-like indications that run the entire length of a joint.
The 1999 failure had cracking and very narrow corrosion grooving that extended, in varying profiles, for essentially the entire length of the joint, thus verifying the concern with of the elastic-wave tool and interpretation of these types of defects.
Also, to determine if the elastic-wave inspection could have missed this type of feature, Enbridge conducted pressure cycling and fatigue-growth studies to estimate crack growth based upon a specified set of normal operating conditions.
This study confirmed that the feature that ultimately failed would have been present during the 1996 elastic-wave inspection.
A crack with dimensions of the failed feature could not have initiated and grown to the extent of failure during the period between the elastic-wave inspection and the failure occurrence.
The CD tool was run through this section of 34-in. line that had encountered the failure.
There were about 460 features identified by the UltraScan CD tool within the 120 km of data that overlaps the elastic-wave data out of the total 255 km of data collected by the CD tool. The elastic-wave vehicle had identified 73 locations requiring excavation.
Enbridge expected the CD tool to provide more information regarding features on the line, due to the increased sensitivity of this tool.
A common constraint of both UltraScan CD and elastic-wave tools is differentiating between crack features and an irregularly trimmed electric-resistance welded (ERW) or flash-welded (FW) seam.
The sharp edges of an irregular trimmed ERW-FW seam provide a very good reflection surface for ultrasonic signals.
Adding to this complexity, an ERW-FW weld is approximately five times smaller than a double-SAW weld, making examination of an ERW-FW long seam much more difficult.
The ultrasonic beam from the sensor floods this small area with ultrasound. Both the UltraScan CD and elastic-wave tools have identified potential crack features that, upon field NDT examination, have turned out to be irregular ERW trim with no crack features present.
In 2001, Enbridge worked together with PII to study the effects of irregular ERW welds and the response generated from CD tool inspection. A test piece of ERW pipe with varying ERW weld trim with multiple crack features was sent to PII facilities in Germany for pull tests.
The testing provided additional experience and insight into this effect. Although the ERW effect is not completely solved, the number of "false calls" has been reduced.
The results provided by the UltraScan CD tool are more detailed than the elastic-wave results, the CD tool having three to four times more sensors than the elastic-wave tool.
Analysis software improvements also provide analysts with better tools for CD data interpretation.
Increased information along with these analysis-software improvements allow for better feature discrimination and sizing from the CD tool.
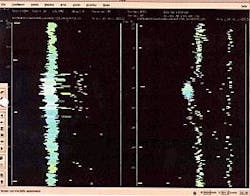
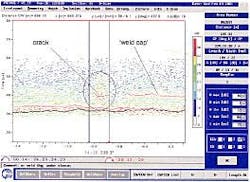
An example of typical CD data is provided in Fig. 9.
The elastic-wave tool has some limitations in sizing crack-like features running the entire length of the long seam. This phenomenon has only appeared on specific, susceptible SAW manufactured pipe within the Enbridge system.
The elastic-wave tool does not provide as detailed a description of long-seam features due to the prominence of the long-seam signal within the elastic-wave analysis software.
The Elastic Wave Vehicle has been successfully used within Enbridge's crack-detection program. The design improvements incorporated into the UltraScan CD tool technology make it the preferred crack inspection tool of these two technologies.
Acknowledgments
The authors acknowledge Enbridge Pipelines Inc. for the opportunity to publish this article with a special thanks to the company's pipeline integrity department and to GE Power Systems Oil & Gas PII Pipeline Solutions.
Based on a presentation to the International Pipeline Conference (ASME), Sept. 29-Oct. 3, 2002, Calgary.
The authors
Garrett Wilkie ([email protected]) is a pipeline integrity engineer at Enbridge Pipelines Inc., Edmonton. In his 6 years with Enbridge, he has also served as an operations engineer and engineering projects engineer. Wilkie holds a degree in electrical engineering from the University of Alberta and a technical diploma in electronics engineering technology from the Northern Alberta Institute of Technology. He is a member of the Association of Professional Engineers, Geologists, and Geophysicists of Alberta.
Tanis Elm is a senior engineer at Enbridge Pipelines Inc., Edmonton, holds a bachelor of science in mechanical engineer (1990) from the University of Calgary, and is a member of NACE and Association of Professional Engineers, Geologists, and Geophysicists of Alberta.
Don Engen has 22 years' experience in corrosion control in oil and gas producing and transmission facilities and is currently a corrosion control analyst with Enbridge Pipelines Inc., Edmonton. He is an accredited NACE corrosion technologist and a member of Alberta Society of Engineering Technologists.
