Forecast and Review: US oil, gas demand to grow as economy recovers in 2002
US demand for oil and gas will increase this year, but the extent to which it does so will depend upon when and to what extent the US economy recovers.
Oil demand will get a boost from lower prices of crude and petroleum products, but lower natural gas prices will offset some demand as fuel switching is curtailed. Gas demand will benefit from those lower prices, and reduced drilling will help to ease high inventories.
US oil production will be nearly unchanged this year, and stocks are forecast to finish the year at end-2001 levels. Motor gasoline demand is expected to be strong in 2002 while other petroleum products, especially jet fuel, will be in less demand.
The economy
Real gross domestic product (GDP) increased an estimated 1% in the US last year, compared with a 2000 increase of 4.1%. Data show that the US economy most likely moved into a recession - meaning 2 consecutive quarters of negative GDP growth - during March of last year.
Efforts by the Federal Open Market Committee to revive the economy were not enough. The Fed lowered interest rates 11 times last year, and the federal funds rate ended 2001 at 1¾%.
The terrorist attacks of Sept. 11 exacerbated weakness in capital spending and industrial production.
Industrial production during the month of November was 5.9% below its level in November 2000, and capacity utilization for total industry during the same period was 6% below that of a year earlier.
Lower interest rates succeeded at keeping home sales strong, even during the fourth quarter of 2001, when employment was declining. The unemployment rate climbed last year to 5.8% in December from 5.7% in November, 5.4% in October, and 4.9% in September.
OGJ expects the economy to remain weak throughout the first half of this year and then strengthen during the second half. GDP growth for 2002 is forecast at 0.5%.
Industrial production is expected to make a partial recovery this year, and housing starts will improve. Auto sales were brisk in the last 3 months of 2001, and sales are expected to remain strong this year.
Consumer spending will continue to increase post-Sept. 11. The Conference Board's index of consumer confidence rebounded in December following 3 months of declines, revealing that consumers were more optimistic about economic prospects 6 months into the future.
Total energy consumption
Recovery and growth in the economy will result in an increase in total energy consumption this year.
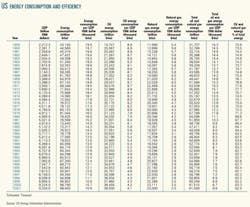
Until last year, demand for energy in the US had increased every year since 1990 when total consumption was 81.3 quadrillion btu (quads). US demand for energy last year totaled 98.5 quads, down from 99.1 quads a year earlier.
OGJ forecasts that total energy consumed in the US will increase this year to 98.85 quads.
Energy efficiency improves nearly every year. As demand has grown, the amount of energy consumed per dollar of GDP has declined. Last year the US economy consumed 10,560 btu/$1 of real GDP, down from 10,740 btu/$1 in 2000. This year efficiency is expected to improve to 10,550 btu/$1 of real GDP.
Energy by source
Demand for all primary energy sources except nuclear power will increase this year in the US.
Natural gas consumption will increase nearly 1% to 23.2 quads following a 1.6% decline last year. Less gas was consumed last year as the run-up in gas prices encouraged electric utilities and other consumers to switch to less expensive fuels whenever possible, and the economic decline took away a chunk of industrial demand. While OGJ expects that this year's lower gas prices will lead to less fuel switching away from gas by utilities, industrial demand will not return to pre-recession levels.
Natural gas will account for 23.5% of total energy consumed in the US in 2002, up slightly from last year, as oil makes up a little less of the energy market. Oil's share of the energy mix was 39.1% last year but is expected to comprise 39% of the total this year.
Still, the amount of oil consumed will rise, though the increase will be nearly negligible. A total of 38.55 quads of oil will be consumed this year vs. 38.5 quads last year. In 2001, oil consumption grew by only 0.2%.
The growth rate in oil consumption will be slowed by a decrease in fuel switching away from gas, but low prices and a small increase in GDP will spur demand slightly.
Together, oil and gas will continue to dominate the energy market in 2002 with a 62.5% share, the same as last year. This compares with a year 2000 combined market share of 62.4%. In 1972, the oil and gas share of the energy market peaked at 77.7%.
Coal energy consumption will increase this year, but at a slower rate than last year. In 2001, demand for coal increased 0.5%; this year the increase is forecast to be 0.2% to 22.6 quads.
While the amount of coal used last year by industrial consumers and electric utilities declined slightly, the amount used by other power producers-which includes nonutility wholesale producers of electricity and some non utility cogeneration plants-increased 25%.
Coal comprises over 50% of all fossil fuels used in the electric power sector and is expected to remain the dominant player as cleaner burning coal-fired plants are commissioned to meet growing demand for power generation.
Coal's share of this year's energy market will be the same as last year at 22.9%, compared with 22.7% in 2000.
Total consumption of nuclear power in 2002 will hold at last year's level of 8.1 quads.
The number of operable nuclear generating units has held at 104 since 1998, and nuclear's share of net electricity generation has been 20% for the past 3 years.
Capacity utilization of nuclear units has been the highest ever in recent years, increasing from 78.2% in 1998 to 85.3% in 1999, then to 88.1% the following year. Last year's capacity utilization is estimated at 91%.
Nuclear power's share of the energy mix will be 8.2% this year, unchanged from a year ago.
With weather in the Northwest drier than normal, energy consumption from hydroelectric power declined more than 20% last year. Assuming that precipitation is back to normal this year, consumption of hydroelectric power should rebound.
All remaining energy demand is satisfied by other renewable sources including wood, waste, alcohol, geothermal, solar, and wind. These sources plus hydroelectric will combine to fulfill 6.5% of US energy demand this year, or 6.4 quads. This compares with 6.3 quads last year and 6.8 quads in 2000.
Oil supply
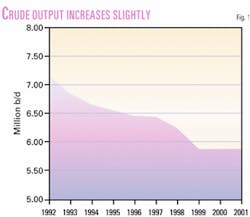
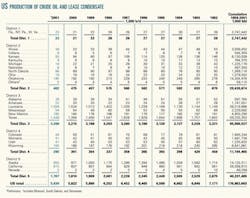
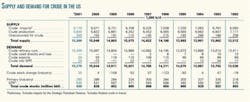
OGJ estimates last year's crude and condensate production in the US averaged 5.83 million b/d. This would be a gain of 8,000 b/d from the previous year's output.
Crude and condensate production in the US fell each year from 1986 until it reversed course in 1991 and rose to an average 7.42 million b/d from 7.36 million b/d a year earlier. Since then, US production was on a steady decline-until last year.
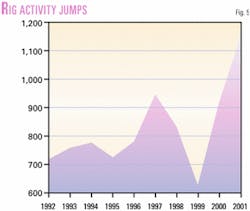
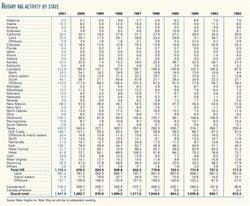
Oil and gas prices began rising in 1999, which led to greater capital spending, which in turn began to boost drilling rates. The Baker Hughes Inc. count of drilling rigs operating in the US moved up to an average 1,160 last year from 918 in year 2000, and 625 the prior year. The highest weekly rig count last year occurred in July at 1,293-a modern day record.
The average rig count will decline this year as lower prices decrease not only the incentive to drill but also the pool of funds available for investment in such activity.
The number of rigs operating in the Gulf of Mexico (GOM) last year increased to an average 147 compared with 136 the year before. While the average number of rigs drilling for gas in the GOM remained at 117, the number drilling for oil increased to 30 last year from an average 19 during the prior year.
Alaskan oil production has declined every year since 1991, when output averaged 1.8 million b/d. During year 2000, production of crude and condensate in Alaska fell to 970,000 b/d from 1.05 million b/d a year earlier and 1.18 million b/d in 1998. Last year, however, production held nearly steady to average an estimated 950,000 b/d.
Lower 48 production of crude and condensate increased to an estimated 4.87 million b/d in 2001, from 4.85 million b/d a year earlier and 4.83 million b/d in 1999.
Output from the Lower 48 in 1998 averaged 5.08 million b/d.
In 2000, production of crude and condensate among the major Lower 48 producing states increased in Louisiana and New Mexico but declined in Texas, Oklahoma, Wyoming, and California.
Estimates of 2001 output show production in Louisiana increasing to 1.56 million b/d from 1.53 million b/d in 2000; in Texas, production was up to 1.45 million b/d from 1.39 million b/d a year earlier; California's production decreased to 815,000 b/d from 837,000 b/d; in Oklahoma, output was down 7,000 b/d to 185,000 b/d; production in New Mexico fell to 180,000 b/d from 184,000 b/d; and in Wyo- ming, output decreased 2,000 b/d to 164,000 b/d.
Total US crude and condensate production is expected to average 5.81 million b/d this year.
Production of natural gas liquids (NGL) in the US will increase this year following a decline in 2001. NGL production averaged 1.9 million b/d in 2000, then fell to 1.85 million b/d last year as high natural gas prices in the first quarter made it uneconomical to extract the liquids. Whereas NGL production during the month of January 2000 averaged 1.96 million b/d, during the following January, NGL output averaged only 1.38 million b/d. Now that gas prices have moderated, NGL production is expected to increase 1.5% this year.
OGJ projects that total 2002 US output of crude and condensate, NGL, and other liquids will inch up to an average 8.06 million b/d compared with 8.05 million b/d last year. US oil output peaked in 1985 at an average 10.64 million b/d.
Stocks
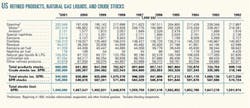
Total industry stocks at the end of 2001 were estimated at 945 million bbl, up from 927 million bbl a year earlier. While crude oil stocks were down 1 million bbl, product inventories grew 19 million bbl last year.
Depressed demand led product stocks to build, especially during the fourth quarter. American Petroleum Institute reported that at the end of November distillate stocks were 15% higher than a year earlier, while gasoline stocks were up 6% year-on-year.
The amount of oil in the SPR finished last year up 4 million bbl to 545 million bbl. SPR stocks are expected to finish this year at the same level.
OGJ forecasts that total industry stocks of oil and products also will be unchanged at the end of 2002.
Imports
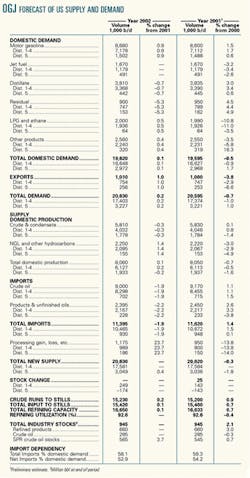
Total industry imports into the US, excluding crude oil for the SPR, will fall to 11.4 million b/d this year from 11.6 million b/d. Total imports during 2000 averaged 11.46 million b/d.
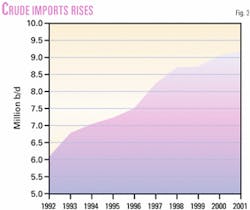
Crude imports this year will fall to an average of 9 million b/d from 9.17 million b/d last year. Product imports will drop to 2.4 million b/d, down from 2.45 million b/d a year ago.
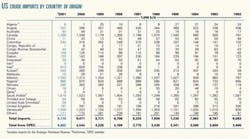
Last year the largest exporter of oil to the US was Saudi Arabia, followed by Mexico, Venezuela, and Canada. The sources of the most US product imports were Canada, the US Virgin Islands, Venezuela, and Algeria.
OGJ estimates that an average 10,000 b/d of crude oil was imported for the SPR last year, up from 8,000 b/d in the previous 2 years. No oil was imported for the SPR during 1995-98.
Refining
Refining capacity in the US continues to slowly increase through incremental additions at existing refineries. So even as throughputs climb, the utilization rate remains flat.
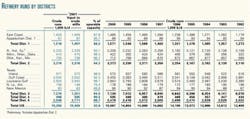
Crude inputs last year increased 0.8% to 15.2 million b/d. Based on API figures for operable capacity of 16.633 million b/d, the refinery utilization rate for 2001 was 92.6%, unchanged from a year earlier when operable capacity was pegged at 16.525 million b/d.
OGJ projects that throughputs and capacity will continue to creep up again this year and that the utilization rate will once again be unchanged. Crude runs are expected to average 15.23 million b/d. Total inputs to stills will move up 0.1% to 15.42 million b/d, and total operable capacity is forecast to reach 16.65 million b/d this year.
Refining margins, prices
US Gulf Coast cash refining margins last year averaged $4.80/bbl, according to Muse, Stancil & Co. The year started off with high refining margins, averaging $6.59/bbl in January, then monthly average margins moderated until they surged to hit their high for the year in April at $10.22/bbl.
The average US Gulf Coast refining margin was lower in May at $8.34/bbl, and then dropped to an average $3.26/ bbl for June. For the second half of the year, monthly margins averaged $2.56/ bbl, falling to $1.63/bbl in December.
For 2000, the US Gulf Coast refining margin averaged $3.95/bbl, as monthly averages remained in a more narrow range-from a low of $2.04/bbl in January to a peak of $5.06/bbl in May.
Prices of oil and oil products declined last year after a strong showing in 2000, but they did not fall as low as the levels they reached in 1999.
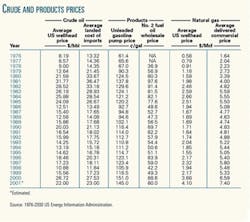
The estimated average US wellhead price of crude oil last year fell to $22/ bbl from a 2000 average of $26.72/ bbl. Relative price weakness began to show in December 2000, when the average US wellhead price of oil dropped to $24.46/bbl from November's average of $30.36/bbl. The wellhead price of oil in the US averaged $15.56/bbl in 1999 and $10.88/bbl in 1998. OGJ expects that wellhead prices will not fall to these levels this year.
The average landed cost of crude oil imports declined last year to $23/bbl from $27.53/bbl a year earlier, while the average composite refiner acquisition cost of crude oil fell last year to an estimated $23.60/bbl from $28.26/ bbl a year earlier.
Refiner wholesale prices of finished motor gasoline were little changed from a year earlier, averaging 96.5¢/gal for the first 9 months of 2001 compared with 95.7¢/gal for the same period in 2000. Likewise, pump prices last year averaged nearly the same as the year before, despite a drop in prices during the fourth quarter of 2001. The average pump price for self-serve unleaded gasoline was an estimated $1.45/gal in 2001 compared with $1.51/gal a year earlier.
A larger portion of the price of gasoline went toward taxes, though, as total gasoline taxes at the pump continued their steady hike last year, averaging 40.8¢/gal, up from 40.3¢/gal in 2000 and 40.1¢/gal the prior year.
Heating oil prices moderated a bit after hitting their highest average in 18 years in 2000. The estimated average wholesale price of No. 2 fuel oil was 80¢/gal last year, down from 88.6¢/gal the year before. In 1999, the average wholesale price was 49.3¢/gal.
Oil demand
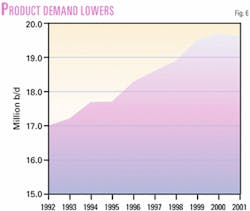
Demand for oil products in the US will be nearly unchanged this year at 19.62 million b/d. Demand for motor gasoline will remain strong while consumption of distillate and residual fuel oil declines. Exports of products and crude will move up 1% to put total demand at 20.63 million b/d.
Last year consumption and exports totaled 20.6 million b/d, a 0.7% decline amid high prices and a contracting economy.
Oil consumption has been rising as the amount of oil energy consumed per dollar of GDP has been declining, indicating greater efficiency. Energy efficiency and oil energy efficiency both improved last year and are expected to continue the trend this year. Oil energy intensity fell to 4,100 btu/$1 last year from 4,200 btu/$1 in 2000.
Jet fuel
Jet fuel demand is expected to be static this year. After Sept. 11, the number of passengers flying as well as the number of routes traveled by commercial carriers was reduced. Business travel was curtailed in light of the recessed economy. As the economy remains in contraction during the first half of this year, business and leisure air travel will remain at reduced levels.
Demand for jet fuel reached its highest annual total in 2000 at 1.725 million b/d, but jet fuel consumption declined 3.2% last year. At the end of the first quarter, however, just after the US economy entered recession, year-to-date deliveries of jet fuel were up 3.9% from a year earlier, according to API.
By the end of August, the year-to-date gain over the first 8 months of 2000 dropped to 1.1%, as weakness in the economy continued to result in a decline in air passengers.
The Air Transport Association of America, a trade group for US airlines, reported last month that passenger enplanements were down 20% in November, but that passenger traffic had continued to improve since Sept. 11.
Motor gasoline
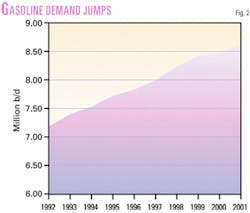
Demand for motor gasoline is expected to increase 0.9% this year to average 8.68 million b/d. This follows a 1.5% increase last year. Although demand has been strong and prices have been low, gasoline inventories have grown on imports and on an increase in domestic production as a spillover from the reduction in jet fuel production. As the economy remains recessed, more travelers will switch away from flying and further boost gasoline demand.
Total motor gasoline stocks finished last year at 208 million bbl compared with 196 million bbl in inventory at the end of 2000. Imports of motor gasoline increased last year to an average of 744,000 b/d from 650,000 b/d the prior year. Production during the fourth quarter of 2001 exceeded that of a year earlier by 200,000 b/d.
Distillate, residual fuel oil
Distillate fuel oil demand will decline 0.7% to 3.81 million b/d this year due to lower natural gas prices. Distillate consumption increased 3% last year on fuel switching from high priced natural gas amid cooler than normal weather in late 2000 and early 2001.
Distillate demand in January 2001 was 12% higher than during the previous January, but as gas prices moderated throughout the year and cold weather dissipated, demand fell back to normal levels. Demand for distillate is also curtailed by a decline in diesel truck traffic associated with decreased economic activity.
OGJ expects demand for residual fuel oil to decline 5.3% to average 900,000 b/d this year following a 4.5% increase last year. Weaker demand will result from the slumping economy and decreased industrial demand, as well as from less fuel switching by power generators during upswings in natural gas prices.
Other petroleum products
Demand for liquid petroleum gas (LPG) and ethane is forecast to edge up 0.5% this year to 2 million b/d. Consumption of LPG and ethane, which is linked to petrochemical demand, declined 10.8% last year.
This year's small boost in demand for these petrochemical feedstocks is contingent upon the economic recovery OGJ expects near the middle of the year.
Demand for all other products as a group, including asphalt and lube oils, is expected to increase 0.4% to 2.56 million b/d. This category of products is also tied to fluctuations in the general economy, rising and falling along with activity in the transportation and construction sectors. The all-time high in deliveries of these petroleum products was recorded in 1999 at 2.82 million b/d.
Natural gas
Total 2002 natural gas consumption in the US will increase following a decline in 2001. Consumption fell to 22.4 tcf last year from 22.8 tcf the prior year and is expected to rebound to 22.6 tcf this year.
While natural gas consumption by residential and commercial users was nearly unchanged from a year earlier, industrial users and electric utilities sharply reduced their demand for gas during 2001.
Decreased use of gas by the industrial sector last year resulted from overall weakness in the economy. Early estimates by US Energy Information Administration peg the drop in demand for gas by industrial consumers at more than 6%. Consistent with OGJ's expectation that the US economy will turn around midyear, industrial demand is expected to make a partial recovery this year, but not yet bounce back to the level it reached before the recession began.
In 1999, industrial demand for gas increased to 9 tcf from 8.7 tcf the year before. Then in 2000, industrial consumers took delivery of 9.5 tcf of gas.
EIA estimates that electric utilities consumed 13% less gas last year than during 2000. Fuel switching was the driver here, as high gas prices turned demand toward less-costly distillate in late 2000 and early 2001.
Deliveries of gas to electric utilities totaled 3 tcf last year and the year before, down from 3.1 tcf in 1999 and 3.3 tcf in 1998. As gas prices have moderated since last winter, electric utility demand for gas is expected to increase slightly this year.
The amount of working gas in storage at the end of 2001-just a year after fears of a supply shortage sent prices soaring-exceeded the normal range as a warmer than normal late autumn delayed the withdrawal season. The first withdrawal of gas from storage occurred during the last week in November, and it was a mere 16 bcf. The number of heating degree days in November was 402, or 24% below normal in the US. Demand remained weak throughout December, as cold weather did not take hold until the final week of the month.
OGJ expects that injections of gas into storage during 2002 will result in another net addition to inventories by the end of the year, albeit a much smaller one than last year.
In 2001, the New York Mercantile Exchange futures price of gas averaged $4.07/MMbtu compared with an average $4.26/MMbtu a year earlier. The highest monthly average closing price of NYMEX gas occurred in December 2000, at $8.32/MMbtu; the December 2001 average was $2.60/MMbtu.
The average US wellhead price of gas was an estimated $4.11/MMcf last year, up from the 2000 average of $3.69/ MMcf, while the average Henry Hub spot price for 2001 declined to $3.98/MMbtu from $4.31/MMbtu a year earlier.
US production of marketed natural gas will hold flat this year. Strong demand and prices helped production ramp up recently, as output increased to 20.25 bcf last year from 20 bcf in 2000, and 19.8 bcf in 1999. Drilling rates have declined sharply since August 2001 on decreased demand. The number of gas-directed drilling rigs operating in the US fell to a total of 748 for the last week in December from 1,068 for the week ended July 13, according to Baker Hughes Inc.
Total gas imports are expected to remain nearly unchanged this year. Imports from Canada via pipeline will be 3.8 tcf. Imports of gas from Mexico were 54.5 bcf in 1999. Then gas imported from Mexico dropped to a total of 12 bcf for each of the past 2 years, and OGJ expects a similar volume will be imported into the US from Mexico this year.
Imports of LNG are forecast to increase 1.4% this year. The US Federal Energy Regulatory Commission has approved a Williams Cos. Inc. request to restart the Cove Point, Md., LNG terminal this year (OGJOnline, Dec. 20, 2001). The facility includes an offshore receiving pier with two unloading docks. Williams plans to begin operations at the terminal during the third quarter of this year, and by the first quarter of 2004, the company plans to complete a fifth storage tank to expand storage capacity to 7.8 bcf from 5 bcf.


