Special Report: Production, reserves climb as profits ebb for OGJ100
This edition of the OGJ100-Oil & Gas Journal's look at the top 100 oil and gas producing enterprises based outside the US-reveals that while output increased last year, profits were generally lower.
There were only small changes from last year on the lists of production and reserves leaders. The companies on the OGJ100 list are still predominantly state-owned companies, but some of their rankings changed.
The OGJ100 list of non-US based companies allows for the comparison of size and performance of prominent oil and gas firms throughout the world. The companies are listed by region according to the location of corporate headquarters. Unlike the OGJ200, these firms are not ranked by assets or by revenues, because many do not report financial results. All financial results included are reported in US dollars.
Net income of the Canadian companies included in this edition of the OGJ100 declined to $6.1 billion last year from $6.2 billion. The combined revenue of these firms, however, increased to $49.4 billion from $48 billion.
Combined net income and combined revenue for the OGJ100 companies based in Europe and Russia declined slightly from a year earlier.
Production, reserves
Worldwide demand for petroleum products last year inched up 0.3%, according to the most recent figures released by the International Energy Agency.
The Paris-based agency also estimates that total worldwide oil supply last year averaged 76.9 million b/d, up from 76.8 million b/d a year earlier.
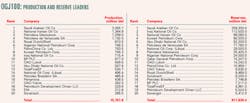
The combined crude and condensate production of the top 20 production leaders based outside the US averaged 43.3 million b/d, or 65% of total output last year based on OGJ figures (OGJ, Mar. 11, 2001, p. 86).
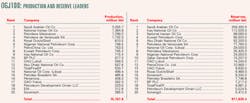
Half of the companies among the top 20 in terms of production and reserves are located in nations belonging to the Organization for Petroleum Exporting Countries.
Still, fluctuations in output allow some nongovernmental companies outside OPEC to climb the list of production leaders. For example, a decrease in Iraq's 2001 production of crude and condensate has resulted in Iraq National Oil Co. falling to No. 9 and has allowed Royal Dutch/Shell to move up one place to No. 5.
Production of 3 billion bbl last year keeps Saudi Arabian Oil Co. at the top of the list of production leaders. In fact, the top four producers are unchanged from last year's OGJ100. National Iranian Oil Co., Petroleos Mexicanos, and Petroleos de Venezuela SA each produced more than 1 billion bbl of oil last year.
The 20 oil reserves leaders hold a total of 918 billion bbl, as estimated for the end of 2001. This is up from 915 billion bbl a year earlier. Reporting oil reserves of 259 billion bbl, Saudi Arabia continues to head the list of reserves leaders.
Based on the most recent OGJ estimates (OGJ, Dec. 24, 2001, p. 125), these 20 entities control 89% of total world crude oil reserves.
Merging the US-based producers into the lists of top 20 firms in terms of production and reserves, ExxonMobil Corp. would rank 6th in worldwide liquids production and 12th among reserves leaders. ChevronTexaco Corp. would be 11th in terms of worldwide production and 16th in terms of reserves.

