COMMENT: Ethanol use in US gasoline should be banned, not expanded
Ethanol does little for energy, harms the environment, and reinforces an oligopoly in the US. Summarizing the work of the many scientists that have calculated ethanol's net energy contribution, we find that expanding the use of ethanol will not significantly reduce America's dependence on imported energy.
Ethanol also is not living up to its environmental expectations. Ozone exceedance data, automotive emissions data, permeation losses, and the implications of ethanol's poorer driveability show that ethanol increases ozone exceedances and toxic air emissions. Eth-anol production facilities emit pollutants, including carcinogens with no offsetting decrease in automotive emissions.
Meanwhile, through production capacity and marketing agreements, four companies control 95% of America's ethanol supply. One refiner has patents that cover the blending of ethanol into gasoline that meets California quality standards.
These facts indicate that not only should we not expand the use of ethanol in gasoline, ethanol should be banned in ozone nonattainment areas and perhaps even nationwide.
Net energy contributions
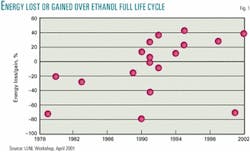
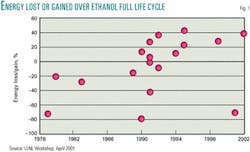
There are many opinions concerning the net energy contribution of ethanol. Amanda Lavigne, a graduate student under the mentorship of Susan Powers of Clarkson University, compiled most of the data shown in Fig. 1.1 I have added a 2001 calculation by Pimetel and a 2002 estimate by the US Department of Agriculture.2
These net energy value calculations are complex and require many assumptions. If we assume all researchers have given their best effort and are unbiased, we should average all the opinions. That average says ethanol gives back only 92% of the energy used to make it.
Due to the many assumptions required to estimate a life-cycle energy balance, bias does creep into the analysis. For example, a government employee whose job depends upon funding approved by a senator from a corn state may be biased to the high side. A scientist who opposes converting food to fuel may be biased on the low side. If to offset the potential for bias we throw out the three highest and the three lowest assumptions, ethanol only gives back 98% of the energy consumed in making it.
The fact that subsidies and mandates are required confirms ethanol's marginal energy contribution and indicates that the current ethanol production technology, while improving, remains economically obsolete and should not be expanded unless ethanol significantly improves air quality. Unfortunately, the data show that ethanol degrades air quality.
In their colloquy on a solution to problems concerning methyl tertiary butyl ether, Sens. Jim Jeffords (I-Vt.) and Robert Smith (R-NH)3 indicated that the Senate had recognized that more energy-efficient ethanol production was required when that body gave ethanol made for cellulose 1.5 times the tax credits of ethanol made from corn. There are two problems with this solution: 1) people are continuing to build inefficient corn ethanol plants, and 2) can we trust the ethanol industry to contain genetically modified or bioengineered bacteria needed to make ethanol from cellulose? Can we trust an industry that is emitting 5-430 times their permitted emissions levels to contain a new creation that has the potential to literally eat us out of house and home? Do the benefits justify the risk?
Lower summer clean gasoline supply
It is important to mention that blending ethanol in summer grade federal reformulated gasoline (RFG) or California RFG actually reduces the refining industry's ability to make the cleaner-burning gasoline and may actually increase crude oil imports.
The blending vapor pressure of ethanol prevents refiners from blending light, clean-burning gasoline components known as pentanes. Refiners try to replace the pentanes by blending more components, known as alkylates or iso-octane. But while these proven components do enable ethanol blending, their supply is limited. The volume of pentanes rejected is slightly greater that the volume of ethanol blended.
This gasoline volume loss when making Phase 2 RFG was a significant factor in the gasoline supply shortage that caused the price spike in the Midwest gasoline market in 2000. An analysis of the alkylate and iso-octane supply potential shortfall contributed to Gov. Gray Davis's decision to delay the use of more ethanol in California.
If the vapor pressure standard is waived, as it is in conventional gasoline, ethanol does extend gasoline supply and could reduce dependence on imported crude. However. that gasoline would produce even more pollution.
Overstated environmental benefits
Another justification for expanding the use of ethanol is that it has been claimed to improve air quality.
The evidence shows that ethanol's atmospheric benefits are overstated. The models used to predict that adding ethanol to gasoline improves air quality are incomplete. When completed, they show that using ethanol in gasoline should increase ozone exceedances.
Ozone is formed when volatile organic compounds (VOCs) and nitrogen oxides (NOx) react in the presence of sunlight. Ozone formation is limited by the reactant (VOC or NOx) that is in short supply. Increasing that reactant increases ozone. Increasing both assures more ozone.
When RFG was introduced in 1995, refiners satisfied the Clean Air Act Amendments of 1990 (CAAA90) by using the "Simple Model" (SM). That means they made the RFG by simply lowering gasoline's vapor pressure and benzene content while adding an oxygenate. The benzene change was too small to significantly impact ozone. The vapor reduction was supposed to help. Ethanol and MTBE were the primary oxygenates chosen. The market allocated ethanol-based RFG to the Midwest ozone nonattainment areas and MTBE-based RFG to the rest of the ozone nonattainment areas. This regionalization lets us compare how well each oxygenate fights ozone.
To see if RFG worked, ozone exceedance data were downloaded from the US Environmental Protection Agency's database for 1993-96. Exceedances of the 1-hr and proposed 8-hr standards were counted on both a monitor site-day basis and a county-day basis. A monitor site-day exceedance was logged each time a monitor exceeded the ozone standard. A county-day exceedance was logged each time at least one monitor in the county exceeded the standard. To see the change in exceedances, EPA used only data from monitors that had been on line at least 75% of the time in each of the 4 years. The ozone exceedance data showed that exceedances increased nationwide between the 2 years before RFG's introduction (1993-94) and the 2 years after RFG's introduction (1995-96).
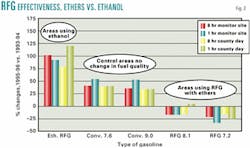
But when the ozone exceedance data is sorted by type of gasoline used and the percentage change calculated and plotted, as in Fig. 2, the nationwide experiment to see if changing gasoline properties could reduce ozone exceedances showed a decrease in areas that had used MTBE-based RFG but an increase in ethanol-based RFG areas.
The increase in nationwide exceedances came mainly from the conventional gasoline areas in which ozone exceedances increased by 33-53% and in which the quality of gasoline did not change. The conventional gasoline areas were the control in this experiment. They reflect weather and other changes. Deviations from this control data set indicate success or failure for the RFG program.
The percentage-change ozone exceedances in areas that used RFG formulated with ethers ranged from a 4% increase to a 34% decrease. On average, this is about 60 percentage points better than the control data set and shows that ether-based RFG reduces ozone.
The fact that ozone exceedances increased 78-119% in ethanol-based RFG areas was a surprise. Ozone exceedan- ces in ethanol-based RFG areas performed 60 points worse than the control experiment.
The timing of the event (switching to RFG) and the effect (changes in ozone exceedances) suggests that ethanol causes ozone exceedances to increase and MTBE causes ozone exceedances to decrease. But good engineering problem-solving practice requires that there be a scientific mechanism by which the event can cause the effect. It would be irresponsible to allege that ethanol causes ozone exceedances to increase if there were no mechanisms that could explain the increases. The following mechanisms explain the increased ozone exceedances.
How ethanol spikes ozone
Ethanol has more NOx emissions than does MTBE. The Auto/Oil Air Quality Improvement Research Program4 emissions study in the early 1990s showed that the NOx increase for 10% ethanol blends was a statistically significant 5%, while the change in NOx emissions for MTBE and other ether blends was not statistically significant. If the Upper Midwest ozone nonattainment areas are NOx limited, that fact alone can explain the increased ozone exceedances.
I attended the workshops in which the US EPA Complex Model (CM) was created. Some of the early regression runs of the data used to create the CM predicted that NOx emissions increased as oxygen content increased. But the workshop discussions about the facts that oxygenates were required and that NOx emissions changes for ethers were not significant-along with what in retrospect could be described as some "solid political science"-were used to justify adjusting the regression analysis that resulted in a NOx-neutral model.
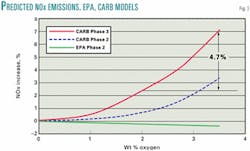
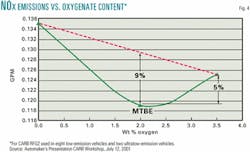
When the California Air Resources Board (CARB) scientists built their gasoline emissions model, called the Predictive Model (PM), they did not seem to apply political science to the regression analysis. Fig. 3 compares the calculated NOx emissions from CARB PM and the federal CM. The CARB Phase 2 PM predicted that NOx emissions from a 10 vol % (3.5 wt %) ethanol blend would be about 3% above those of an 11 vol % (2 wt %) MTBE blend. But the CARB Phase 3 model indicates the 10 vol % ethanol blend has 4.7% more NOx emissions than the typical MTBE-based RFG. This indicates that CARB's scientists believe that the increased NOx emissions from ethanol-based RFG are real.
Recent data confirm that ethanol blends emit more NOx than do ether blends. In a CARB July 12, 2001, workshop, automobile industry representatives presented the NOx emissions data shown in Fig. 4.5
Note that the 5% increase in NOx emissions between the MTBE and ethanol blends is close to the 4.7% increase predicted by CARB's Phase 3 PM. Thus it appears that the NOx emissions for a 10 vol % ethanol blend are about 5% more than they are for an 11 vol % MTBE blend. Also, if the response is proportional to ethanol content, NOx emissions will increase 9% relative to MTBE-based gasoline, and California's NOx-limited ozone nonattainment areas will suffer a significant increase in ozone emissions if ethanol is used in those areas. Based upon these data, CARB's PM, and the Auto/Oil data, ethanol should not be used in gasoline in NOx-limited ozone nonattainment areas.
If the area is not NOx-limited, there is evidence that ethanol-based RFG has more exhaust VOC and evaporative VOC emissions than predicted by either CARB's or EPA's models.
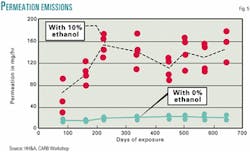
At that same July 12, 2001, CARB workshop, Harold Haskell & Associates (working as a consultant for CARB) presented data that help explain why ozone exceedances doubled in the cities using ethanol-based RFG. Fig. 5 contains those data.6
Because it takes about 200 days for the permeation losses to come to equilibrium, the emissions test data that were used to build the EPA and CARB models do not reflect ethanol permeation through the various seals in automotive fuel systems. But the timing of the switch to ethanol-based RFG would cause more evaporative VOC emissions during the ozone seasons and provide a mechanism that links ethanol to the increased ozone exceedances.
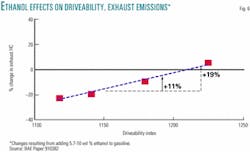
Another mechanism that helps to explain ozone increasing in areas that used ethanol-based RFG are the auto industry's data showing that poor driveability increases exhaust emissions. In their World Fuel Charter,7 the Alliance of Automobile Manufacturers state that gasoline containing 10 vol % ethanol has a driveability index that is 70 points higher or worse than that of gasoline containing only hydrocarbons or ethers. The combination of these factors indicates that ethanol blends have 19% more exhaust emissions than pure hydrocarbon or hydrocarbon-ether blends with the same distillation properties, as illustrated in Fig. 6. This is a big factor, because exhaust emissions are three times as likely to form ozone as evaporative emissions.
To see if the increased NOx and VOC emissions from gasoline containing ethanol could explain the doubling of ozone exceedances, I amended EPA's Phase 2 CM. NOx emissions were adjusted based upon the data in Fig. 4. The gasohol permeation data in Fig. 5 were used to adjust Hot Soak and Diurnal VOC emissions. Exhaust VOC and air toxics emissions were adjusted to reflect the change in exhaust hydrocarbon emissions relative to driveability index in Fig. 6. EPA's model and the amended EPA model were used to calculate the emissions from gasoline meeting the prevailing SM standards for RFG.
The properties of the SM gasoline were the same as those of baseline gasoline, except:
- The Reid vapor pressure was lowered to 8.0 psi.
- The benzene content was lowered to 0.7 vol % (0.9 vol % met the benzene standard and the toxics standard for MTBE blends, but 0.7 vol % was required for the ethanol blends to meet the toxics reduction standard.
- The oxygen content was either 2.1 wt % from MTBE or 3.5 wt % from ethanol.
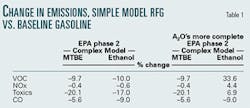
When these properties were put into both the basic CM and the more complete model, the calculated change in emissions relative to baseline gasoline were as shown in Table 1. Like the ozone exceedances that decreased, emissions decreased for the MTBE-based gasoline. But using ethanol in SM RFG causes NOx, VOC, and air toxics emissions to increase.
The greater NOx emissions, evaporative VOC emissions, and exhaust VOC emissions relative to baseline gasoline explain the increased ozone exceedan- ces in areas that used ethanol-based RFG when the RFG program began.
Ethanol industry claims
Lately, the ethanol industry has been publicizing the fact that ozone exceedances in the ethanol-based RFG areas have recently declined.
But the timetable indicates that ethanol increased ozone and that introducing CM gasoline and reducing sulfur to about 100 ppm from over 400 ppm8 is responsible for the recent reduction in ozone. When applying problem-solving techniques properly, the timetable of changes vs. observations has two functions: It identifies possible causes, and it eliminates causes that cannot have caused the observed effect.
When ethanol-based RFG was introduced in the Midwest, the main change in gasoline quality was the addition of ethanol. Exceedances doubled. Midwest RFG ethanol content has remained essentially constant since 1995. Therefore, ethanol could not have caused the recent reduction in ozone exceedances. The switch to the Phase 1 CM in 1998 and the Phase 2 CM in 2000 forced refiners to lower the sulfur content of gasoline.
The reduction in sulfur content more than offsets the increased NOx emissions caused by ethanol. The auto industry, for promoting sulfur reduction, and the refining industry, for actually reducing sulfur content, deserve the credit for offsetting ethanol's defects and lowering ozone.
The decreased emissions calculated for MTBE-based RFG explain the decreased ozone exceedances in ether-based RFG areas. Permeation losses are declining but not disappearing. Ethanol's driveability problem is real, according to the Alliance of Automobile Manufacturers. Old and new data show that ethanol-based gasoline emits more NOx. Timing and these mechanisms show that ethanol caused the ozone exceedances to double; the question remains as to what ethanol addition will do to Phase 2 RFG or Phase 3 California RFG (CaRFG3).
To answer that question, the properties of CaRFG3 were processed in the more complete model. While ethanol addition does reduce carbon monoxide (CO) emissions, its NOx, VOC, and toxics emissions increase relative to a nonoxygenated CaRFG3 and a CaRFG3 containing MTBE. Using ethanol is more likely to increase ozone exceedances and cancer risk. Using MTBE implied less ozone and cancer risk than the nonoxygenated CaRFG3. The differences in emissions between the oxygenated and nonoxygenated CaRFG3 blends are shown in Table 2.
These data indicate America should be reducing, not increasing, the use of ethanol in motor gasoline.
California's switch from MTBE to ethanol is another experiment in atmospheric science. If California ozone exceedances increase in 2003 and 2004, the nation is going to either have to live with poorer air quality or figure out how to phase out the use of ethanol. With 55% of California's gasoline committed to switch to ethanol this year, it is prudent to wait until we see if that atmospheric chemistry experiment strips ethanol of its elegant green robes before Congress mandates the use of more ethanol.
Ethanol plant emissions
In April, EPA began a crackdown on ethanol production facilities that are emitting 5-430 times more VOCs, including carcinogens, than their permits allow.
Based upon a May 3 article by Philip Brasher of the Associated Press,9 the federal government said, "Factories that convert corn into the gasoline additive ethanol are releasing carbon monoxide, ethanol, and some carcinogens at levels 'many times greater' than they promised. In an Apr. 24 letter to the industry's trade group, the Environmental Protection Agency said the problem is common to 'most, if not all, ethanol facilities….
"VOCs being released by the ethanol plants include formaldehyde and acetic acid, both carcinogens. Methanol, although not known to cause cancer, also is classified as a hazardous pollutant… Recent tests have found VOC emissions ranging from 120 tons a year, for some of the smallest plants, up to 1,000 tons annually.
"When the plants were built, many reported VOC emissions well below 100 tons a year, allowing them to bypass a lengthy and stringent EPA permitting process. Plants with emissions above 100 tons annually are classified as 'major sources' of pollution under the Clean Air Act and are more heavily regulated.'"
Given the difference in paperwork and cost for the 100 ton/year cutoff, EPA and perhaps even Congress should investigate these early estimates of emissions levels from these plants.
In a June 3 meeting dubbed Ethanol Production Air Permitting, Compliance, and Resolution Framework,10 EPA Region 5 showed data from 4 ethanol production facilities in which the emissions were 5-430 times the permitted limits.
There are 61 ethanol plants, primarily in the Midwest, and another 14 under construction that could multiply this pollution. If ethanol were reducing ozone, one could argue that this increase in emissions was justified. But, using ethanol in motor gasoline increases automotive emissions of NOx, air toxics, VOCs, and ozone. Also, the ethanol plant emissions can still cause ozone exceedances and increased emissions of carcinogens downwind. Therefore, we must treat ethanol plants as chemical plants.
Plants that exceed their permits should be shut down and modified to come into compliance immediately. New plants should be assumed to be major sources subject to the same standards as other chemical plants until they are proven otherwise.
The pollution from the ethanol production facilities does not include the increased use of diesel fuel, fertilizers, and pesticides to increase corn production or the runoff that pollutes US water supply and creates additional unquantified, but probably adverse, health effects.
Antitrust questions
In their Feb. 27 briefing for Sen. Dianne Feinstein (D-Calif.),11 the US General Accounting Office (GAO) stated that the ethanol industry was highly concentrated.
Its Herfindahl-Hirshman Index (HHI), used to calculate business concentration, was 1,866. Anything above 1,800 is considered highly concentrated. High concentration limits competition. GAO based this HHI on production capacity data that showed that the largest firm had 41% market share, while the top four firms had 58% market share.
If marketing agreements are included, the problem is worse. While attending the spring National Petrochemical & Refiners Association meeting, Fred Potter, president of Information Resources Inc., told me that one company, through its production capacity and marketing agreements, controls over half of the ethanol supply and four companies control 95% of the supply. GAO should ask to see Potter's data and recalculate the ethanol industry HHI. I suspect the actual HHI will be totally unacceptable. One of these companies is trying to buy more ethanol capacity. The Federal Trade Commission should block that acquisition and investigate to see if marketing agreements are a form of de facto market control before Congress reinforces the ethanol oligopoly's power to price-gouge.
There is also the potential for excessive market control from the refining side in California. One refiner holds US patents (6,290,734 and 6,328,772) covering the use of ethanol in gasoline that meets California's stringent standards. So far, that refiner has chosen not to pursue or enforce the patents. But will it continue that generosity after ethanol is widely used in California?
Conclusions
The average ethanol life cycle energy balance indicates more energy is needed to make ethanol than ethanol gives back.
Even the latest ethanol production technology has at best a small energy contribution.
Ethanol's use in SM RFG increases NOx, VOC, and air toxics emissions relative to baseline gasoline.
Its use in RFG caused ozone exceedances to double during 1993-94 and 1995-96.
Its use has not changed since 1995 and, therefore, ethanol cannot have caused the recent ozone reductions in the Midwest. Reducing sulfur content probably did.
America should wait to see if California's switch to ethanol confirms or denies that ethanol increases ozone before we mandate more ethanol use.
According to EPA, most if not all ethanol producers are out of compliance with their emissions permits.
Ninety-five percent of ethanol supply is controlled by four companies.
One refiner holds patents on ethanol's use in gasoline meeting California standards.
If we do not want to wait for the outcome of the California experiment, the use of ethanol in motor gasoline should be banned, not expanded.
References
- "The Net Energy Value Of Ethanol: Critical Issues," Amanda Lavigne and Dr. Susan E. Powers, Clarkson University. Presented at the Workshop on the Increased Use of Ethanol and Alkylates in Automotive Fuels in California sponsored by the Lawrence Livermore National Laboratory on Apr. 10-11, 2001.
- "The Energy Balance of Corn Ethanol: An Update," Hosein Shapouri, James Duffield, and Michael Wang, US Department of Agriculture, Office of the Chief Economist, Office of Energy Policy and New Uses, Agricultural Economic Report No. 813.
- Statements of Sens. Jim Jeffords (I-Vt.) and Robert Smith (R-NH), Congressional Record, pp. S5443-6, June 12, 2002.
- Technical Bulletin No. 6, Emissions Results of Oxygenated Gasolines and Changes in RVP, Auto/Oil Air Quality Improvement Program, September 1991.
- "Industry Low Sulfur Test Program" results presented by the Alliance of Automobile Manufacturers at the California Air Resources Board (CARB) Workshop Regarding Regulatory Fuel Activities, July 12, 2001.
- "Evaporative Emission Effects (Permeation) Created by Ethanol in Gasoline," presented by Harold Haskew, Harold Haskew & Associates Inc., at the CARB Workshop Regarding Regulatory Fuel Activities, July 12, 2001.
- World-Wide Fuel Charter, Alliance of Automobile Manufacturers, p. 11, (Note: Temperature conversion makes the driveability index correction term for 20x wt % oxygen from ethanol), April 2000.
- Chicago Gasoline Average Sulfur Content, American Automobile Manufacturers Association and Alliance of Automobile Manufacturers Gasoline Quality Surveys.
- Article by Philip Brasher, Associated Press, May 2, 2002.
- "Ethanol Production Air Permitting, Compliance, and Resolution Framework," US Environmental Protection Agency Region 5, June 3, 2002.
- "US Ethanol Market: MTBE ban in California," Letter from Jim Wells, director, Natural Resources and Environment, United States General Accounting Office to Sen. Dianne Feinstein, (D-Cal.), Feb. 27, 2002.
The author
Cal Hodge is president of A 2nd Opinion Inc. (A2O). His firm advises on regulatory, clean fuels, and economic issues. He has 34 years of experience in refining and petrochemicals economics, strategic planning, fuel formulations, governmental affairs, litigation, product distribution, industry analysis, and regulatory compliance. Prior to founding A2O in 1998, Hodge held positions with Amoco Corp., Pace Consultants & Engineers, and Valero Energy Corp. His early focus included a specialization in unleaded premium gasoline blending prior to the introduction of unleaded regular. Hodge developed an expertise on refinery economics in the late 1960s and has taught other engineers and clients basic refining economics principles and applications. He gained further expertise in gasoline regulations, clean fuels, and air quality by participating in the regulatory negotiation that resulted in US federal reformulated gasoline regulations. Hodge graduated from the University of Kansas in 1968 with a BS in chemical engineering. His e-mail is [email protected].
