North Sea evolution to track Gulf of Mexico model
Second of two articles on development prospects off Europe
The North Sea (for purposes of this article the UK, Norway, and Denmark) produced about 6.5 million b/d of oil in 2001, representing about 14% of non-OPEC (Organization of Petroleum Exporting Countries) production. Even with high depletion rates and declining field size, the North Sea will continue to be a sizable producer of crude oil for the foreseeable future.
Our view is that the companies that were best positioned to originally develop and produce the giant fields of the North Sea are probably not the best positioned to develop and produce the remaining smaller fields. This change contains significant implications for both exploration and production companies and for energy service providers
Production profiles
During 1989-99, UK Continental Shelf (UKCS) oil production increased 45% (averaging 3.8%/year) and peaked in 1999 at 2.72 million b/d. It has declined to 2.2 million b/d today. Since 1994, field depletion rates have averaged 11.4%/year. The average production of oil per UKCS field declined to 17,700 b/d/field in 2000 from 32,600 b/d/field in 1994, a compound annual decline of 9.6%.
Norwegian North Sea oil production in 2000-01 reached 3.3 million b/d, but has been generally flat since 1996. Since 1994, field depletion rates have averaged 9%/year. The average production per Norwegian North Sea field declined to 86,600 b/d/field in 2000 from 109,650 b/d/field in 1994, a compound annual decline of 4.5%.
The depletion factor
Net depletion, which is where our analysis concentrates, is the annual decline rate after new wells and work-overs have been conducted. Gross depletion is the rate of annual decline before additional wells and workovers are conducted.
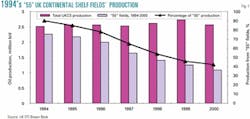
Since 1994, the UKCS has faced an 11.4% annual net depletion rate on the 55 fields that were operating in 1994 and were still in service in 2000 (Fig. 1).
These 55 fields accounted for 90% of UKCS production in 1994. By 2000, they produced only 43% of the UKCS total, a fairly significant decline over a 7-year period. Only a substantial increase in the number of producing fields (to 145 from 77) maintained production volumes at slightly more than 2.5 million b/d during 1994-2000.
Norway faced a 9% annual net depletion rate on the 14 fields operating in 1994 and still in service in 2000. These 14 fields accounted for 89% of Norwegian production in 1994. By 2000, they only produced 41% of Norwegian production. Even if production had remained flat at 2.7 million b/d, the core fields in 1994 would only account for 50% of current production.
Fields shrink, age
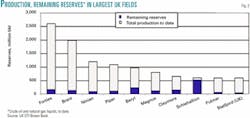
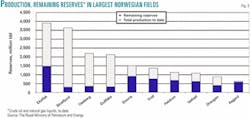
In 2000, the largest UK field was Schiehallion, which produced 115,000 b/d of oil. In 2000, previous giants such as Brent (73,000 b/d), Scott (57,500 b/d), and Forties (59,000 b/d) struggled to remain in the "Top 10" producers list. These old work-horses of the UK have declined, but equal-sized fields-with the possible exception of Buzzard, discovered in 2001 (OGJ Online, June 24, 2002)-have not replaced them. The 10 largest fields ever discovered in the UK are nearly fully depleted (Fig. 2).
Few reserves remain in the UK's original Top 10 fields. Excluding Schiehallion, the other nine fields currently contain only 10% of their original estimated reserves.
In Norway in 1994, 23 fields produced an average of 109,650 b/d/ field. In 2000, 36 fields produced an average of 86,600 b/d/field. Although this is a 56% increase in the number of fields, it represents a 4% compound annual decline in per-field production.
In 1994, the three largest fields produced over 500,000 b/d of oil each. By 2000, however, the largest producing field, Ekofisk, produced just over 300,000 b/d. While the Norwegian sector still has 11 fields that each produce more than the largest UK field, the trend to declining field size is similar to that of the UK.
Another major factor that highlights Norwegian production declines is the near-total depletion of three of the four largest fields and significant depletion of the remaining six largest fields ever discovered in Norway (Fig. 3).
Production conclusions
This confirms three recent historical trends in the North Sea:
- Annual production from the original "giants" is declining.
- Overall field size is shrinking.
- The industry has been rapidly developing more fields.
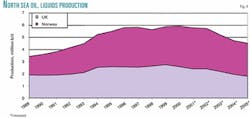
As a consequence of these factors, Simmons & Co. International's production forecast assumes a decline in UK oil production to 1.78 million b/d of oil by 2005. Our long-range production forecast for Norway assumes a slow decline in oil production and that oil production will average 2.7 million b/d in 2005.
Simmons believes that the combined North Sea production of the UK and Norway peaked at 5.9 million b/d of oil in 2000. We estimate that production will decline to 5.7 million b/d in 2002 and 2003 before declining more rapidly to 4.7 million b/d by 2005.
Given the 10% average net depletion rate, the decline in field sizes, the large long-term decline in exploration and appraisal drilling, and the lack of multiple large projects that could increase production over the next 4 years, we believe these estimates for North Sea production are reasonable.
Production trends
BP PLC and Royal Dutch/Shell Group account for almost half of UKCS operated production. Statoil ASA and Norsk Hydro ASA dominate Norway's production.
Fields are shrinking in the UKCS in terms of spending and reserves per field. Some of the decreased spending per field is due to efficiencies and improvements and some to taking advantage of existing infrastructure. However, such a powerful and extended downward trend in spending per field can only be explained by the fact that fields today are smaller.
BP's situation is an example of the impact of smaller fields. Worldwide, in 2001 BP produced 3.4 million boe/d. If we assume a conservative annual depletion rate of 8%, then BP needs to replace 270,000 boe/d in 2002, just to maintain flat oil production. This is equivalent to 15.4 new UKCS oil fields. In addition to this, BP has a 5.5% annual production growth target, which cannot be achieved in a mature basin such as the UKCS.
We fully expect BP will continue to prosecute small developments and subsea tiebacks to its existing fields to mitigate the impacts of depletion and to take advantage of high oil prices. However, given the limited number of fields identified as new developments, even BP may have decided that development of the average UKCS oil field is not the best use of its admittedly large, but limited, resources.
Another economic argument against continued investment by the majors in small fields is related to materiality. Even if a small field is economically positive for a major, it might not generate the scale of return and volumes necessary for a meaningful impact.
Secondly, a major needs large projects that can generate future large cash flows. Small, incremental well-to-well projects do not fit the bill.
Significance for the North Sea
The major E&P companies must deliver large production volume growth each year in order to overcome their own depletion rates and achieve growth targets. Thus a maturing North Sea with shrinking field sizes and higher depletion rates is less economically attractive. A capital and labor-constrained industry combined with a quest for the "biggest bang for the buck" forces the largest E&Ps to go after the "elephants" in deepwater and other frontiers. Therefore, we expect major E&Ps to deemphasize the North Sea and independents to raise their profiles there, especially in the UK.
To some extent, this is already happening. In the UK, the independent E&Ps are now the most active drillers, and recent licensing rounds have seen an influx of independent E&Ps. Independent E&Ps have also aggressively entered the UK through acquisition of producing properties.
We believe the oil service industry and independent E&P companies will be long-term beneficiaries of this changing market.
A change to GOM model
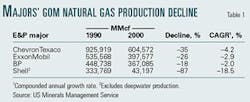
Simmons believes that the future prosperity of the North Sea depends on a steady influx of independent E&P companies, combined with a measured exit strategy by the major E&Ps. Our model for this is the US Gulf of Mexico (GOM), which saw major E&Ps deemphasize the shallow-water continental shelf in favor of international and deepwater GOM opportunities during the 1990s (Table 1).
In 1990, the Top 10 GOM producers consisted of 7 majors and only 3 nonmajors. By 2000, however, 7 of the Top 10 were nonmajors and only 3 were majors.
The majors did not abandon the GOM, but it did receive less emphasis.
As a direct contrast, several independents performed exceptionally well during the last decade in growing natural gas production in the shallow waters of the GOM (Table 2). Independent E&Ps generated production growth both from acquisitions and drilling activities.
Interestingly, total GOM production, which includes deep water, was effectively unchanged at 4.9 tcf/year during 1990-2000. However, excluding deepwater production, shelf natural gas production has declined to 4 tcf/year, representing an 18% decline over 10 years and a compounded annual growth rate (CAGR) of -2%. The majors' share of GOM shelf production has declined to one third, down from one half in 1990.
As we expect to occur in the UKCS, the move of majors towards GOM deep water and away from the GOM shelf was a rational response to a market that was seeing its economics squeezed by shrinking field size and increasing depletion rates.
Surprisingly, all of these changes did not negatively impact activity in the gulf.
As majors have shifted from the GOM shallow water, nonmajors and independents have taken up the slack and even increased overall activity in the shallow-water regions. This is a positive harbinger of what could happen in the UKCS and eventually in Norway.
The shift from majors to nonmajors in a mature pro- vince does not mean that spending in that region must decline. What matters are the prospects and economics of the region and having the appropriate companies positioned to take advantage of the available potential.
North Sea independents
It is not our assumption that the independents are likely to realize huge operating cost savings or other savings because of superior operating methods or technology. The North Sea has a harsh environment and possesses substantial regulatory hurdles, making it one of the most expensive operating regions in the world.
There are several significant reasons why independents are better suited for small field developments. Among these key attributes are a more entrepreneurial approach, results-focused management and ownership, and smaller size.
Other UKCS issues
- Government. The UKCS is a difficult regulatory environment. Some of the regulations pertaining to the area can be altered and would help speed the transformation of the UKCS over the next several years. Ironically, the recent tax increase may accelerate the exiting of the majors, but the damage to the UK's reputation as a low-cost and predictable region for conducting operations may offset the benefits.
- Cyclicality. Cyclicality is likely to become more pronounced as independent E&Ps account for an increasing percentage of drilling activity and production and as field size continues to decline. The capital spending of independent E&Ps is tied much more to actual cash flows than is true for the majors. This likely will lead in the future to higher highs and lower lows in spending, drilling, employment, and general activity levels in the UKCS.
- Infrastructure. Ownership of the UKCS infrastructure is also concentrated in the hands of the majors. BP, Royal Dutch/Shell and TotalFinaElf SA own 50% of the oil and condensate pipelines and platforms in the UKCS. This dominant ownership position of the majors is an impediment to independent E&Ps.
Winners and losers
Change is coming to the UKCS. Future winners and losers among oil service companies will be those that best adapt to this changing market and changing conditions:
- Oil service companies should benefit from a more fractured customer base.
- Dependency of smaller E&Ps is set to increase.
- Production improvements are key to profitability.
- Increasingly cyclical markets will develop.
- Oil service companies focusing on operating will be advantaged.
- Large-scale project providers will be hurt.
Among the independent E&Ps, the winners will be those that:
- Do not overpay for their market entry.
- Are vigilant about capital and operating costs.
- Are best at enhancing production from "tired" reservoirs.
- Find and develop previously untapped production.
- Can control their destiny through core or sole ownership positions of field and pipeline infrastructure.
- Enhance utilization of existing infrastructure.
Prognosis
- North Sea oil and liquids production has peaked. The North Sea will continue to be a sizable producer of crude oil for the foreseeable future. However, high depletion rates and declining field size will continue to make the region less attractive to major E&P companies. Changes are already under way that will fundamentally alter the type of E&P company that drives activity in the North Sea.
- The North Sea is changing. What has been a market dominated by large fields and major oil companies is transforming into a market consisting of smaller fields. These are more attractive to-and their economics are more aligned with-those of independent E&P companies.
- Smaller fields make the future focus on depletion, not starting up major fields. High depletion rates and declining field sizes indicate that production growth is highly unlikely, and the real battle of the present and the future focuses on fighting decline curves.
- The GOM is the proxy. Over the last decade, the GOM shelf has experienced significant changes as decline rates have increased. Major E&Ps have exited and been replaced by independent E&Ps. Activity levels, while still cyclical, have been maintained in spite of increased depletion rates and declining production as the independent E&Ps develop the remaining reserves of the GOM. We believe the North Sea will follow this model.
- Majors are likely to become less important in the North Sea as independents become more important. Shrinking field sizes and higher depletion rates make the North Sea less economically attractive to major E&P companies. Independent E&Ps are now the most active drillers in the UK and are highly represented in the most recent licensing rounds in the UK and Norway. Independent E&Ps have also aggressively entered the UK market through acquisitions of producing properties. Independents are the future of the North Sea.
The author Roger D. Read received his bachelor's degree in business administration (accounting) from Southern Methodist University. He then worked for Ernst & Young and Halliburton Co. and qualified as a certified public accountant. Read earned an MBA degree in 1996 from Rice University's Jones School in Houston. He then joined Simmons & Co. International, working in the company's Houston research group during 1996 through early 2000, and covering US and Canadian oil service companies before relocating to the firm's Aberdeen office to head up coverage of European oil service companies.
