Four of the most frequently discussed challenging issues in the geophysical industry are:
- How can we map the porosity profile of an existing or potential reservoir to eliminate the cost of drilling dry wells?
- Can we accurately map the open fractures, faults, and joints in the reservoir rocks for better understanding of the fluid flow in the reservoir to optimize the field production?
- How is best to map the permeable units in the reservoir, which are important, to understand the flow patterns between the wells and between the reservoir facies for accurate reservoir simulation?
- How can we map changes in the reservoir pore fluids that are caused due to production and injection processes; can we accurately monitor the fluid fronts?
In an earlier article, we addressed the issue, "How we can map the natural open fractures and the porosity zones by using elastic nonlinear measurements of the reservoir rocks?" (OGJ, Sept. 10, 2001, p. 83).
In continuation of the previous article, we here address mapping the reservoir permeability and identifying the pore fluids by measuring the elastic nonlinear interaction of the seismic signals as they propagate through poroelastic rocks.
Nonlinear seismic imaging
Heterogeneous materials such as reservoir rocks have extreme elastically nonlinear behavior due to their structural defects.
Large deviations in their nonlinear and hysteretic properties can be caused when the consolidation and-or saturation conditions change in the reservoir. Accurate measurement of the changes in elastic nonlinear properties can be a sensitive measure of the pore fluids and their movement.
In the linear theory of elasticity two elastic waves do not interact, the equations of motion are linear, and the principle of superposition holds.
In an elastically nonlinear medium, Westervelt1 was the first to show that two collinear high frequency primary waves could interact to produce acoustic waves with frequencies equal to the sum and difference frequencies of the primaries.
Additionally when a discrete frequency seismic signal or a swept frequency seismic signal propagates through the elastically nonlinear reservoir rock, the related harmonics are generated. The relative amplitudes of the odd and even harmonics depend on the physical properties of the rock and its pore fluids.
Either odd or even harmonics of the input frequency will dominate the output spectra. Their relative amplitudes will depend on the viscosity of the pore fluid. The measurement of the changes in the relative amplitudes of these odd and even harmonics caused due to hydrocarbon production over time is a sensitive measure of the fluid changes in the reservoir rock.
Time-lapse imaging
Hydrocarbon production from a reservoir over time causes changes in the pressure distribution, oil-water contact, gas:oil ratio, temperature, etc.
Seismic sensitivity to these changes that occur over a period of time due to production and injection can be used for time-lapse seismic to monitor the bypassed oil, map fluid flow barriers, fluid saturation changes, and for mapping the fluid fronts.
The changes in the internal parameters of the reservoir rocks due to fluid movement affect the propagation characteristics of the seismic wave as it travels through the reservoir at different time intervals during a production or injection phase.
Since the propagation of seismic wave is a coupled motion between rock matrix and pore fluids, its propagation characteristics change according to the changes of the internal parameters in the reservoir. The changes in the viscosity of the reservoir pore fluids make a major contribution in the elastically nonlinear seismic response of the time-lapse seismic recording.
Viscosity is the property of a fluid that tends to prevent it from flowing when subjected to an applied force; high viscosity fluids resist flow while low viscosity fluids flow easily. Because of this effect the seismic wave propagation characteristics are different during the propagation of the seismic wave through the rocks that have high viscosity pore fluids versus low viscosity pore fluids.
Viscosity determines the amount of friction, which in turn determines the amount of energy absorbed due to pore fluid movement during the propagation of a seismic wave through a fluid-saturated reservoir rock.
When a seismic wave travels through a sedimentary reservoir rock, the matrix (mineral frame) of the rock is deformed, the pore fluid is compressed, dragged, and pressured to flow. Fluids and solids are compressed as if they were individual springs connected together in different configurations.
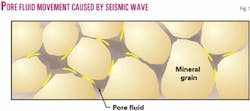
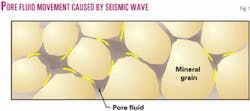
The pore fluids are mobile, so they are squeezed and squirted out of the thin cracks (Fig. 1) into larger pores as the rock matrix is compressed by the propagation of a seismic wave. The solid-fluid interaction is intimately connected. The viscosity of the pore fluid plays an important part in a solid's oscillatory motion due to viscous friction and inertial coupling.
Due to elastic nonlinearity and the pore fluid viscosity, hysteresis is observed in the stress-strain relationship of a reservoir rock when exposed to an oscillatory seismic wave.
Hysteresis is a property of viscoelastic materials and is strongly associated with the pore fluid motion. Hysteresis represents the history dependence of physical systems.
If you push on something, it yields: when you release, does it spring back completely? If it does not, it is exhibiting hysteresis. So, if there is a difference in the stress-strain relation between loading and unloading cycles of a rock then it can be categorized as hysteretic. The area of the stress-strain hysteresis loop represents energy dissipation as heat during the load cycle.
When a sinusoidal seismic wave propagates through the reservoir rock, the load is reversed from the compression to the rarefaction cycle of the seismic wave and the pore fluid is rearranged due to the deformation of the rock matrix in a confined space. This causes a lag between stress and strain, determining the size of the hysteresis loop. This phenomenon is dominated by the properties of the pore fluids (Fig. 2).
Time lag is fluid-dependent. Long chain fluid molecules give rise to higher time lags. Higher hysteresis, at seismic frequencies, is related to the higher viscosity of the pore fluids.
Oil that has higher viscosity compared to water and gas will display a more pronounced hysteretic behavior to an oscillatory seismic wave, compared to water or natural gas that has lower viscosity.
Since the nonlinear hysteretic behavior of the saturated reservoir rock generates harmonics of the primary signal, the measurement of these harmonics can be used as a diagnostic tool for determining the fluid saturation and the type of pore fluids.
The characteristic of the second and other even harmonics is that the primary signal waveform during compression and rarefaction cycles is not identical (Fig. 3). So the presence of the even harmonics is indicative that the compression cycle of a sinusoidal seismic wave is different from the rarefaction cycle. The rock behaves differently when it is compressed compared to when the compression is removed.
The third harmonic, on the other hand, is generated when the distortion during compression and rarefaction cycles of the sinusoidal seismic wave is symmetrical. This indicates that the stress-strain relationship, at seismic frequencies, during compression and rarefaction cycles is similar. This in turn is indicative that the viscosity of the pore fluids is such that rock is exhibiting less hysteresis. Pore fluids have lower viscosity.
Due to the complex nature of the rock composition, we may expect both odd and even harmonics generated when a seismic wave travels through an elastically nonlinear reservoir rock. But, the even harmonics will dominate when the pore fluids, like oil, have higher viscosity. The odd harmonics will be more pronounced when we have lower-viscosity pore fluids like natural gas.
The measurements of the relative amplitudes of the odd and even harmonics of a primary seismic wave (signal) and the differences in their relative amplitudes over time will indicate the changes and the movement of the pore fluids caused due to hydrocarbon production.
The measurements of the spectral changes in the relative amplitudes of the odd and even harmonics of the primary input signal are used to determine the changes of the reservoir fluids in the reservoir rocks due to hydrocarbon production over time.
The dominance of the even harmonics in the reflected seismic signals is indicative of the higher-viscosity pore fluids like oil, and the dominance of the odd harmonics indicates presence of the lower-viscosity fluids like natural gas (Fig. 3). Any changes in the relative amplitudes of the odd or even harmonics, in time-lapse recording, will relate to the changes in the reservoir pore fluids that have taken place due to hydrocarbon production.
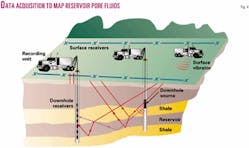
By plotting the relative amplitudes of the odd and even harmonics and the changes in their amplitudes over time, the movement of the reservoir fluids can be mapped. The method, as shown in Fig. 4 and described in this article, is equally applicable for surface seismic recording methods, borehole seismic, or any combination of the wellbore and surface seismic.
Mapping permeability
Permeability is often the most important factor in influencing the commercial viability of a hydrocarbon reservoir.
So far, permeability cannot be measured directly in situ in reservoir formations.
Downhole tools that measure permeability in a borehole quite often provide ambiguous results, and these results are confined to the immediate vicinity of the wellbore.
Measurement or estimation of permeability in carbonate reservoir rocks is even more difficult, since carbonates are more heterogeneous compared to sandstones.
A new seismic method that can estimate the bulk permeability of the reservoir formations between the wells will be extremely useful for implementing an efficient production program for a hydrocarbon-producing field that will optimize the economics of the hydrocarbon recovery.
Slow-wave
Biot2 proposed a comprehensive theory that explained many important features of the seismic wave propagation in fluid-saturated porous media.
One of the important contributions of his theory is the prediction of a slow compressional wave with a speed lower than that of the rock matrix or the pore fluid.
The slow-wave involves a coupled motion between the fluid and the solid frame. The slow-wave's velocity and attenuation depend on the morphology of the pore space and the pore interconnections, which also determine the fluid transport properties such as permeability. The detection of the presence of the slow-wave in a reservoir formation between two wells is a strong indicator that the formation is permeable.
The slow-wave has been successfully measured under laboratory conditions using samples of glass beads and sandstone samples from typical reservoir formations (Berea and Massillon). Considerable effort has been made to detect the slow-wave in sedimentary rocks in situ. So far this effort has not been very successful.
Since information related to in situ rock permeability of the reservoir formations is extremely important for developing an accurate reservoir simulation model of its flow units, a new method of estimating the permeability of in situ reservoir formations has been developed. Using this method, we determine the existence and the properties of the slow-wave for estimating the bulk tortuosity and permeability of the in situ reservoir formations.
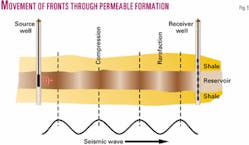
This method (Fig. 5) introduces a new way of mapping reservoir flow units by identifying the in situ permeability of the reservoir formations between the existing wells.
To economically produce hydrocarbons from a reservoir, the reservoir rocks have to be porous so that the fluids can be stored in the pores. The pores have to be connected so that the reservoir fluids can flow between the pores. The capacity of transmitting a fluid in a rock depends on the size and shape of the pores, size and shape of the interconnections and their extent, and is known as permeability.
When a pressure wave travels through a rock, the rock matrix and pore fluids are simultaneously compressed. The velocity of the compressional wave in the rock matrix is related to the mineral frame and the cementation between the grains, while the velocity of the slower component of the compressional wave that travels through the interconnected fluid path is determined by the physical properties of the pore fluids and the tortuosity of the connected pores in the rock (Fig. 6).
The slow-wave travels at the fluid compressional velocity but over a longer distance along the tortuous interconnected pores between the two ends of the reservoir formation, which is being measured.
Permeable rocks are elastically nonlinear due to:
- Their morphology;
- The microstructures of their pores;
- The pore interconnections; and
- Pore fluids.
In a permeable rock that is elastically nonlinear, the interactions between two elastic waves can be used in a unique way to map its physical properties.
An elastic wave generated within a rock can be made to interfere with an externally generated seismic signal, and their elastic nonlinear interaction can be measured to determine the bulk tortuosity and permeability of a reservoir formation.
Drag-wave
When the primary external signal is a sinusoidal wave of a predetermined frequency and time duration, it creates a moving wave of compressional and rarefaction fronts that are repetitive and travel one wavelength apart.
Each compressional front is separated from the next compressional front by a wavelength. Due to the physical coupling between the rock matrix and the fluid-filled pores, a drag-wave is generated as the primary sinusoidal wave propagates through the rock matrix.
The drag-wave propagates through the fluid-filled interconnected pores at the same velocity as the slow-wave. This velocity depends on the pore fluid properties and the tortuous path of the pore interconnections.
The primary sinusoidal wave and the drag-wave propagate through the rock simultaneously and they elastically interact with each other. Due to the elastic nonlinearity of the permeable rock, the interaction between these two waves can be detected and measured as the elastic nonlinear interaction of the high-frequency primary-wave and the low-frequency drag-wave.
When two elastically linear seismic waves travel together in a subsurface formation, the principle of superposition holds and there is no interaction between the two waves. However, when they travel through a formation that is elastically nonlinear, then a nonlinear interaction between the two elastic waves occurs, and summed and differenced frequencies are generated.
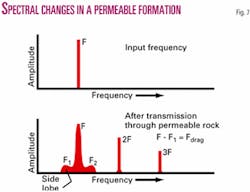
In a permeable subsurface formation that is nonlinear, the interaction between the high-frequency primary-wave and the low-frequency drag-wave generates the summed and differenced frequencies of the two seismic signals. These summed and differenced frequencies appear as the side lobes of the Primary-Wave spectrum (Fig. 7), and can be measured.
The measured values provide us with information that directly translates into the frequency content of the drag-wave. Measurement of the drag-wave frequency and its relative amplitude is directly related to the bulk tortuosity and bulk permeability of the reservoir formation.
Since the drag-wave is generated by the liquid-solid coupled motion of the primary-wave, its frequency is determined by the primary-wave frequency, the velocity of the primary-wave, and the velocity of the drag-wave.
The velocity of the primary-wave can be determined by the first seismic arrivals of the crosswell seismic data; it is a standard practice and well known in the industry today. The frequency of the primary-wave is the frequency of the input signal transmitted by the downhole source, in this case a predetermined sinusoidal signal.
The frequency of the drag-wave can be measured from the display of the side lobes of the frequency spectrum, since they result from summing and differencing of the primary-wave frequency and the drag-wave frequency. The velocity of the Drag-Wave can be calculated by
Fdrag / F = Vdrag / (V - Vdrag)
where Fdrag is the frequency of the drag-wave; F is the frequency of the primary-wave; Vdrag is the velocity of the drag-wave; and V is the velocity of the primary-wave.
The drag-wave velocity and the slow-wave velocity are the same, since the drag-wave is a form of slow-wave that is generated as the primary-wave propagates through a reservoir formation, due to the coupling between the rock matrix and the pore fluids.
For this article, the drag-wave nomenclature has been used since there is some confusion with the true meaning of "slow-wave" in the way it has been used by different authors in the published literature.
Once the drag-wave velocity is known, the bulk tortuosity 'T' which is (Lt/L)2, where 'L' is the straight line distance, and 'Lt' is the tortuous path of the fluid through the pores of the reservoir formation between two wells and it can be calculated as
Vdrag = Vfluid (L/Lt)
Basically, this equation says that the drag-wave travels at the fluid compressional velocity, but over the longer distance along the tortuous interconnected pores between two end points of a reservoir formation (between two wells).
Scheidegger3 showed that permeability of a solid that has porosity 'f' containing sinuous pores of constant radius 'r' and tortuosity 'T' is given by
K = Ø r2/8T
where 'K' is the permeability of the rock. Once the bulk tortuosity of a reservoir formation has been determined, the bulk permeability can be estimated. The permeability is strongly dependent on pore size and is also a function of the rock tortuosity.
Mapping reservoir rock properties
The amplitude of the summed and differenced frequencies of the two seismic waves, which are created due to the nonlinear elastic interaction in a permeable rock, is directly related to the product of the amplitudes of the two waves.
So, the relative amplitude of the frequency side lobes created due to the interaction between the primary-wave and the drag-wave gives us a measure of the relative amplitude of the drag-wave, since the primary-wave input signal is known.
Knowing the relative amplitude of the drag-wave between different well pairs, and by keeping the input signal at a constant level, we are able to determine a qualitative measure of the rock properties of the reservoir formation between one well pair to the next well pair.
The amplitude of the drag-wave is related to the transfer of energy from the compressional wave to the pore fluids. This transfer of energy is more efficient if the pores are flat rather than circular. The amplitude of the drag-wave is also related to the width and size of the interconnections between the pores; it is a qualitative measure of the bulk permeability of the rock formation between the two wells.
The other useful information that is derived from the spectral analysis of the received and recorded signal is the presence and the relative amplitudes of the second and third harmonics of the fundamental frequency. The second and third harmonics are indicative of the elastic nonlinearity of the rock formation between the two wells.
Rocks are elastically nonlinear due to structural defects in their matrix or frame caused by microfracturing, porosity, permeability, and fluid saturation. The presence of harmonics, along with the frequency side lobes created by the presence of drag-wave, is a further confirmation of permeability of a rock formation between the two wells.
Based on experience in operating and producing from a particular reservoir, a geologic model of the reservoir is already in place. This geologic model can be calibrated against the new information that is added in the form of relative amplitudes of the drag-wave and the relative nonlinearity of the reservoir rock between different well pairs.
This method outlines a new concept of measuring in situ the velocity of the slow compressional wave (drag-wave), and the bulk tortuosity of a permeable reservoir formation. Absence of the drag-wave between any two sampled depths in the source and receiver wells indicates that between those two levels there is no straight-line permeable connection between the two wells.
The field implementation of this technology is relatively easy and requires standard crosswell seismic equipment, which is generally available. It is a standard practice to use a downhole source in one well and receiver arrays in adjacent wells.
The current standard equipment can easily be adapted to transmit monofrequency signals at discrete pre-selected frequencies and recordings made using multiple downhole receivers with independent outputs.
Emerging technology
When we try to image the physical properties of the reservoir rocks, quite often we are faced with subjective interpretation of a complex and mostly unknown reality.
What is usually lacking is the means to map the reservoir heterogeneities that are essential for understanding the porosity, permeability, and the pore fluids, which govern the flow patterns between the wells and between different reservoir facies. In most cases, the required answers are not found by mapping around the vicinity of the existing wells.
Nonlinear seismic imaging holds a promise of identifying and mapping in situ reservoir properties which would help in improving the economics of finding and adding new hydrocarbon reserves in the existing and new fields. Nonlinear elastic wave interaction between seismic signals can be used in unique ways to map rock properties of the reservoirs.
We have shown in this article that new elastic waves are generated within the reservoir formation when an externally generated signal propagates through them. The result of the interference and the mixing of the external signal with the internally generated signals is measured and used for precise determination of the reservoir properties.
(Application has been made for the relevant patents.)
References
- Westervelt, Peter J., "Parametric Acoustic Array," The Journal of the Acoustical Society of America, 1963.
- Biot, M.A., "Theory of propagation of elastic waves in a fluid saturated porous solid," The Journal of the Acoustical Society of America, 1956.
- Scheidegger, A.E., "Physics of flow through porous media," University of Toronto, 1960.
The authors
Tawassul Khan is president and CEO of Nonlinear Seismic Imaging Inc. with over 40 years of experience in the seismic industry worldwide. His work history includes positions with Halliburton Geophysical Services, Reservoir Imaging Inc., Western Atlas International, and Baker Hughes Inc. He has held management positions in operations, research, business development, marketing, and engineering. He has a BA degree in physics and mathematics from Punjab University and a BS degree in engineering from London University.
Sofia McGuire ([email protected]) is vice president of Nonlinear Seismic Imaging and is involved with managing the company's business activities. She has been involved independently in financial services since 1986. She holds a BA degree in managerial studies from Rice University and an executive MBA degree from the University of Houston.
