New Correlation predicts liquid holdup in gas-condensate pipeline
Pipeline Design Tools - Conclusion
A simple-to-use correlation has been developed which better predicts liquid holdup in gas-condensate transmission, two-phase flow pipelines. Research for the correlation is based on data from Iran's Kangan gas field.
Two-phase flow pipelines need accurate calculations for pressure drop and liquid holdup in order to size properly the lines and equipment.
Until now, however, the estimation of two-phase flow liquid holdup relied on methods which are either empirical or semiempirical. These correlations were based on very limited data obtained from small-diameter, air-water systems.
Extrapolation of these data to larger lines and to hydrocarbon systems was questionable at best.1 Application of these correlations can lead to results which are grossly in error.2 3 Because of this, two-phase equipment can be designed badly, leading to unnecessary costs or even failure.4
This is the second of two articles that present new and simpler pipeline design approaches. The first part (OGJ, July 1, 2002, p. 62) was entitled "New approximation of friction factor developed for general gas flow equation."
Analysis
The amount of liquid holdup in pipelines is a function of the pipe slope, input liquid content, and the velocities of the gas-liquid phases themselves, dependent on the fluid flow rates.
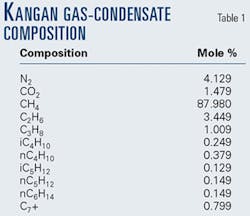
Early pilot studies with air-water mixtures indicated a significant ordering of data with a combination of Froude number, pipe angle, and input liquid content.5 6 In this study, this ordering is used as the basis for developing the liquid holdup correlation based on the Kangan gas-condensate pipeline data.7 Table 1 shows the gas analysis used to design the pipeline.
Also, the parameters of the C7+ fraction are: molecular weight 120.8, normal boiling point 396.2 K., critical temperature 576.6 K., critical pressure 28.3 atm., and acentric factor 0.362.
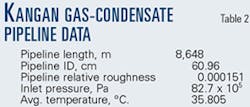
Table 2 shows typical data for the Kangan gas-condensate pipeline. From the data, it is apparent that the volumetric flow is predominantly gas; therefore, detailed consideration of the pipeline elevation profile was not important for a steady-state flow. Thus, one can arrive at a simple relationship between liquid holdup and mixture Froude number and input liquid content.
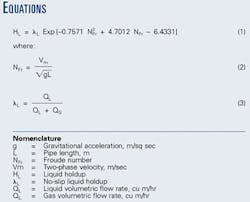
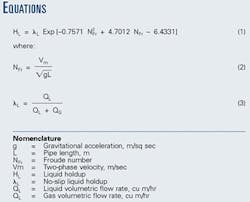
An equation was obtained (Equation 1 in Equations box) which is independent of flow pattern. It is obvious, however, that it will not apply to all flow conditions.
Results
Table 3 shows the results of liquid holdup vs. several gas flow rates predicted with the different correlations.5 6 8-10
Also, Table 4 shows results of error percent and average percentage deviation for prediction of pressure drop using the above methods. Note that by the present model these tables show good agreement between measurement data and calculated results.
The simple, easy-to-use correlation presented here fit the Kangan gas-condensate field data in spite of the vast differences in pipeline parameters and a disregard for elevation profiles effect.
The application of the proposed correlation should be tested further with more field data.
References
- Cindric, D.T., Gandhi, S.L., and Williams, R.A.,"Designing Piping Systems For Two-Phase Flow," Chem. Eng. Progress, March 1987, pp. 51-59.
- Muller, S.H., and Heck, K., Chem. Eng. Process, Vol. 20, No. 297, 1986.
- Holt, A.J., Azzopardi, B.J., and Biddulph, M.W.,"Two-Phase Flow Modeling and Experimental," Int. Symp., Oct. 9-11, 1995.
- Holt, A.J., Azzopardi, B.J., and Biddulph, M.W.,"Calculation of Two-Phase Pressure Drop For Vertical Up Flow In Specific Model," Trans, IchemE, 77, Part A, Jan. 7-15, 1999.
- Beggs, H.D., and Brill, J.P., "A study of Two-Phase Flow in Inclined Pipes," JPT, 1973, pp. 607-17.
- Mukherjee, H., and Brill, J.P., "Liquid Holdup Correlation for Inclined Two-Phase Flow," JPT, Vol. 35, No. 5, May 1983, pp. 1003-08.
- Mokhatab, S.,"Correlation predicts pressure drop in gas-condensate pipelines," OGJ, Jan. 28, 2002, pp. 66-68.
- Lockhart, R.W., and Martinelli, R.C., "Proposed Correlation of Data for Isothermal Two-Phase, Two-Component Flow in Pipes," Chemical Eng. Progress, Vol. 45, No. 1, 1949, p. 39.
- Eaton, B.A., et al., "The Prediction of Flow Pattern, Liquid Holdup and Pressure Losses Occurring During Continuous Two-Phase Flow in Horizontal Pipelines," JPT, 1967, pp. 815-28.
- Dukler, A.E., "Gas-Liquid Flow in Pipelines Research Results," American Gas Assn. Project NX-28, 1969.


