Corporate consolidations, facility closures, and nearly flat gas production growth in 2001 combined with extraordinarily high natural gas prices early in the year to drive the world's largest gas-processing country-the US-to reduce plant capacities and throughput.
Despite these contractions, North American processors benefited early in 2001 from NGL prices high enough to strain their historical relationship to crude oil.
Offsetting US reductions, however, was Canada, which increased capacity and throughput, as Western Canadian gas producers sought to meet increased US demand through more competitive pipeline routes to that market.
The resulting picture for 2001, as revealed in this exclusive annual report, was one of continued dominance of worldwide gas processing by Canada and the US, on the one hand, and the surging growth of gas processing in areas outside North America, on the other.
Snapshots
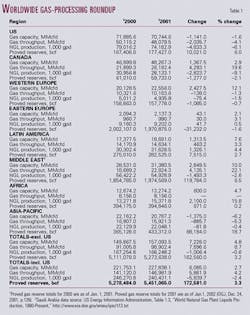
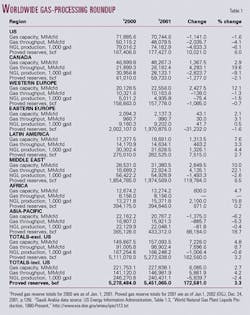
Canada and the US held 52% of the world's gas-processing capacity and produced more than 42% of the world's NGL in 2001 (Table 1). If you pull Mexico briefly from the Latin America column and add its figures to those for Canada and the US, the North American industry held more than 55% of the world's processing capacity for 2001 and nearly 52% of its NGL production.
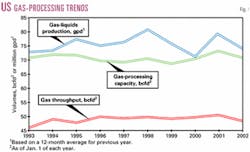
On Jan. 1, 2002, US gas-processing capacity stood at more than 70 bcfd; throughput in 2001 averaged more than 48 bcfd; and NGL production, more than 74 million gpd (more than 1.7 million b/d; Fig. 1).
In the US in 2000, high energy prices carried lofty NGL prices into 2001 but began to fall toward more normal levels in the second half of the year.
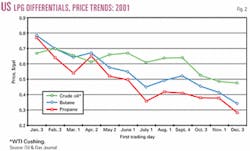
Fig. 2 shows pricing differentials in the US between LPG-the most widely traded NGL-and crude oil for the first trading day of each month in 2001. Through the first 4 months of the year, both propane and butane traded well out of their usual differentials against crude oil of 60-70%.
Afterward, however, LPG prices consistently moved lower faster than crude oil prices. At the end of the year, LPG's normal price relationship with crude oil had been essentially reestablished.
Propane in 2001 was hit by weak demand as a heating fuel, thanks to a warmer than normal winter, and as an ethylene feedstock by a weak ethylene market. Norman butane was also hit by weak demand at the end of the winter gasoline-blending season and as an ethylene feedstock.
As 2002 began, data for Canadian gas-processing capacity showed it at more than 48 bcfd with an average of more than 26 bcfd going through the country's plants last year. NGL production was more than 28 million gpd.
As impressive as is the North American dominance in activity, it seems clearly waning as Oil & Gas Journal figures continue to show more processing capacity arising outside North America.
For 2000 for the US and Canada, all figures but one were higher than for 2001: Canada and the US held more than 53% of the world's gas-processing capacity and produced nearly 45% of the world's NGL. Combined with Mexico, the North American share was nearly 56% of the world's processing capacity and more than 50% of its NGL production.
Only NGL production for the three countries was higher in 2001 than in 2000.
As the US industry was contracting, the industry outside the US was expanding and not only in Canada. Total capacity outside the US for 2001 increased by nearly 5% to 157 bcfd; throughput by more than 8% to nearly 99 bcfd. Only NGL production was flat outside the US.
Capacity for regions outside the North American countries including Mexico increased by nearly 6%, throughput by more than 5%, and NGL production by more than 1.5%.
Sources; the world
All gas-processing activity figures in the breakout tables that start on p. 70 are based on Oil & Gas Journal's most recent exclusive, plant-by-plant, worldwide gas-processing survey and its international survey of petroleum-derived sulfur recovery (p. 105).
In addition and as noted in last year's report (OGJ, June 25, 2001, p. 25), new data for Canada for 2000 form a new baseline because in 2001, OGJ obtained new plant-by-plant data from Alberta's Energy and Utilities Board (AEUB) that was fundamentally more accurate and current than data used in recent years from the AEUB.
These new data reflected actual figures for gas that moved through the province's plants and were reported monthly to the AEUB. Previously, OGJ had only been able to estimate throughput from National Energy Board numbers.
For 2000, OGJ took these new data for all of Alberta and compiled annual figures and thereby created a new baseline for data comparisons thenceforth.
In addition to AEUB figures for Alberta and to operator responses to its annual survey, OGJ has supplemented its Canadian data with information from the British Columbia Ministry of Employment & Investment's Engineering and Operations Branch and the Saskatchewan Ministry of Energy & Mines.
For Saudi Arabia, the world's second largest NGL-producing country as of 2001, NGL production data are an aggregate published by the US Energy Information Administration.
At the start of 2002 outside Canada and the US, gas-processing capacity stood at more than 108 bcfd; throughput for 2001 averaged more than 72.7 bcfd; and NGL production averaged more than 138 million gpd.
As noted, these figures all reflect increases over 2000 as the world outside Canada and the US, especially the countries of Western Europe and the Middle East, produced more gas and gas liquids to meet improving domestic and regional economies.
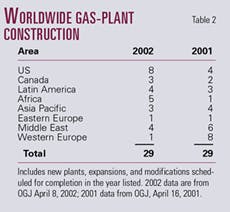
Table 2 provides a snapshot of the current state of gas plant construction in the world.
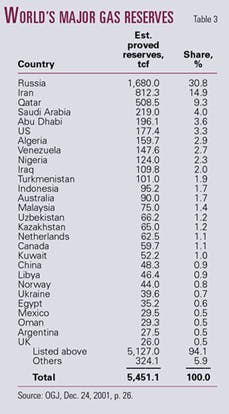
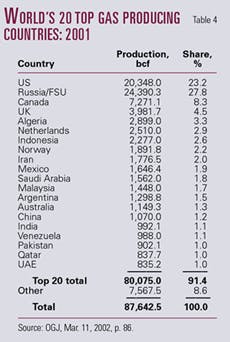
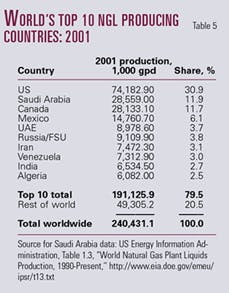
Table 3 ranks the world's major natural-gas reserves by country at the start of 2002; Table 4, the world's top natural-gas producing countries for 2001; and Table 5, the world's leading NGL producers.
In petroleum-derived sulfur recovery, Canada and the US continued to dominate the world in 2001, holding more than 46% of processing capacity and almost 46% of actual production.
For worldwide production of sulfur derived from refining and natural gas, Canada last year accounted for more than 27% of the overall total; the US, more than 19%.
