The application of microscopic momentum balance, energy balance, Peng-Robinson's equation of state, and heat transfer equations can predict the pressure and temperature profiles of a pseudohomogeneous gas-liquid mixture in a gas production well.
One can consider a dispersed gas-liquid mixture flowing at high velocity in a gas well to be pseudohomogeneous.
Peng-Robinson's equation of state calculates the local density and partial derivatives of the high-pressure gas in the gas phase. Heat balance and heat transfer equations determine the heat loss of the flowing gas-liquid mixture through multiple layers of steel walls and casing fluid to the surrounding formation. Momentum and energy balances yield two interacting differential equations that are solved by the fourth-order Runge-Kutta method simultaneously, without using an assumption to disengage them.
One can apply these equations (see equation box) to a single-phase flow of dense gas or gaseous mixture in a gas well by setting the quality of gas-liquid mixture (xG) to 1.
The temperature profile calculation includes the Joule-Thomson effect.
Click here to view Equations pdf
Gas production
In natural gas production wells, a gas-liquid, two-phase mixture flows at a high velocity and pressure from the bottomhole to the wellhead through producing tubing that can be more than 10,000 ft in length.
The hot gas-liquid mixture from the bottomhole loses heat to the surrounding formation as it travels to the wellhead.
Operators have a considerable interest especially in cold climate regions for determining this heat loss.
They typically have handled changes in pressure and temperature by assuming linear temperature profiles from the bottomhole to the wellhead and using an average temperature to calculate the pressure drop for the flowing gas-liquid mixture.1-3
A newer approach is for them to consider the momentum and energy balances of the flowing gas-liquid mixture.4-6 This approach yields a set of two interacting simultaneous ordinary differential equations that can be solved with a simplifying assumption.
By using an average gas density, Chierici disengaged the two differential equations and solved them separately by the finite difference method.4 Sagar5 and Hason and Kabir6 separated the two equations by assuming a constant for the sum of pressure drops due to friction and acceleration.
After that assumption, one can calculate independently the pressure and temperature profiles of gas from these two equations.
In the present work after the author developed the momentum and energy equations, he used a fourth-order Runge- Kutta method7 to solve these two equations simultaneously, without a simplifying assumption to disengage them.
Depending on the mixture GOR and velocity, two-phase flow has different flow patterns such as annular-mist flow, slug flow, and bubble flow. These two-phase flow patterns have been studied extensively in recent years.8-11
One may consider the gas-liquid mixture as a pseudohomogeneous fluid when the gas is the continuous phase and it flows at a high velocity, carrying fine liquid droplets.11
Mixture properties
The definition of specific volume of a two-phase mixture in slug flow and bubble flow is defined in terms of gas holdup (void fraction).8-10 For a pseudohomogeneous gas-liquid mixture, it can be defined by the quality of the mixture xG (Equation 1).8
This definition follows the conventional practice in engineering thermodynamics and makes the application of the equation of state simple. Equations 2-4 give the viscosity, heat capacity, and thermal conductivity of the mixture. The specific volume of liquid is negligible because it is much less sensitive to the changes in temperature and pressure than the gas.
As a result, the partial derivatives of specific volume of the mixture with respect to pressure and temperature are almost equal to that of the gas multiplied by the quality (Equations 5 and 6).
The molar gas volume, which is used in the equation of state, is equal to the specific volume multiplied by the molecular weight, Mo, of the gas (Equation 7).
Momentum, energy equations
In a well, conductor pipe, casings, annular fluids, and cement separate the production tubing from the formation.
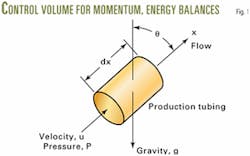
A pipe element (Fig. 1) illustrates the application of microscopic momentum and energy balances for developing the equations. The inclined angle u is measured from a vertical line. It is zero, when the pipe is vertical. The coordinate x is in the direction of flow.
The momentum balance equation yields the pressure gradient of flow (Equation 8). The fF is Fanning's friction factor, and m? is the total mass flow rate of the gas-liquid mixture. The pressure gradient in Equation 8 is the total pressure gradient, which includes the pressure drops due to friction, gravity, and acceleration.
The microscopic energy balance yields the temperature-gradient (Equation 9). In the equation, Q represents the rate of heat loss of the gas-liquid mixture to the formation, and J is the unit conversion, 1 Nm/J (or 778.17 ft-lbf/btu). The first term on the right-hand side of an equal sign represents the temperature change due to the heat loss, and the second term represents the Joule-Thomson effect.
Equation of state
One can calculate the specific volume of the gas in the gas-phase at high pressures from an equation of state, such as Peng-Robinson's equation of state, given by Equations 10-14.12 Equation 7 converts the molar volume VwG to the specific volume.
Partial differentiation of Equation 10 with respect to pressure and temperature yields Equations 15 and 16 that are needed in Equations 8 and 9 to calculate the pressure and temperature gradients.
Heat transfer
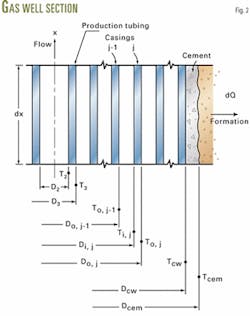
The heat loss from the gas-liquid mixture flowing inside the production tubing to the surrounding formation is a case of combined conductive-convective heat transfer (Fig. 2).
The first step of heat transfer is convection of heat from the mixture to the inner wall of production tubing. Its convective heat transfer coefficient hTP can be obtained from the Mastanaiah-Ganic correlation13 or the Dittus-Boelter correlation (Equation 18).14
The latter is Equation 18. D2 is the production tubing ID.
One can calculate the Reynolds and Prandtl numbers from the properties given by Equations 1-4 and the rate of heat transfer through a series of steel walls, casing fluids, and a cement layer from the overall heat transfer coefficient U2. The number of casings depends on the vertical location.
The heat transfer through tubing walls is a simple heat conduction and is given by Fourier's law. The thermal conductivity of steel casing walls is 26 btu/hr-ft-°F. (45 W/m-K.).14
Heat transfer through casing fluid is the heat convection of fluid in an enclosed space. In writing a heat transfer equation, however, it is considered as an effective heat conduction. Equation 19 gives its effective thermal conductivity,15 and Equation 20 calculates the Grashof number for the casing fluid.
Equation 21 gives the rate of heat transfer per unit length of pipe from the mixture at temperature T to the formation at TE. Equation 22 calculates the overall heat transfer coefficient, based on the inside diameter of the production tubing.
These terms inside the summation in the equation represent the total resistance to the heat flow through these steel walls and casing fluids. The number of casings at a given location x is represented by n.
The thermal conductivity of cement varies from 0.3 to 0.6 btu/hr-ft-°F. (0.52-1.0 W/m-K.).15 16 Ramey provides the method for calculating the heat conduction from the outside surface of a cement layer to the formation.16 The heat transfer equation has a temperature function, f(t) (Equation 23). In the equation, the af is the thermal diffusivity of the formation.
The formation temperature tE, depends on depth and can be represented by one or two linear equations.17 In most cases one equation appears to be sufficient (Equation 24).
To is the surface temperature of the earth, and a is the geothermal gradient, which is equal to 1-2° F./100 ft (1.8 to 3.6° C./100 m).
For offshore gas wells, seawater may surround a section of casing. Equation 25 gives rate of heat loss by this section, and Equation 26 gives the overall heat-transfer coefficient, where the last term reflects the heat convection to the seawater.
Equation 27 calculates the convective heat-transfer coefficient of seawater hsw, assuming a cross flow over a cylindrical surface.14
Runge-Kutta method
Equations 8 and 9 solve for the pressure and temperature profiles of gas-liquid mixture. The fourth order Runge-Kutta method7 is an optimal numerical procedure between the accuracy and computational time in solving these two simultaneous differential equations. The method does not need an assumption to disengage these two interacting equations.
For convenience, Equations 8 and 9 express the pressure and temperature gradients in simple notations: f(P,T,x) and g(P,T,x), as shown by Equations 28 and 29. The functions f(P,T,x) and g(P,T,x) are used to calculate pressure and temperature increments in the step-by-step calculations.Equations 30-33 and Equations 34-37 provide the increment functions of pressure kP and temperature kT, respectively.
Once these increment functions are known, one can calculate the pressure and temperature profiles step-by-step with Equations 38 and 39, starting from the bottomhole (i = 0) to the wellhead.
Each step calculates the physical properties of the gas-liquid mixture and overall heat transfer coefficients at the local temperature and pressure at x. The number of casings, n, also varies with respect to x.
Sample calculation
A sample calculation tested the mathematical model presented by Equations 1-27 and the computational procedure given by Equations 30-39.
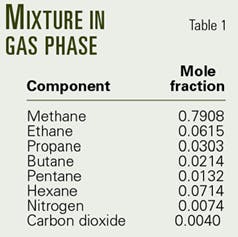
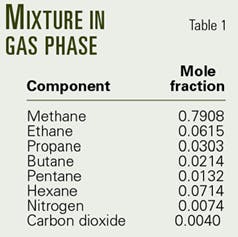
In this sample calculation, the flow rate of gas-liquid mixture is 11.05 MMscfd, and the quality of the gas-liquid mixture is 95%. Table 1 shows the gas composition in the gas-phase, which includes methane, ethane, etc.
The producing tubing ID and length are 2.75 in. and 17,717 ft, respectively. It is surrounded by one to five casings at various depths. The geothermal gradient is 0.0133° F./ft, and the bottomhole pressure and temperature are 302° F. and 14,435 psia, respectively.
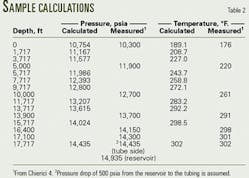
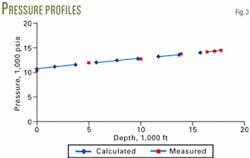
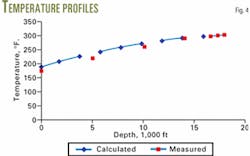
Table 2 and Figs. 3 and 4 present the results of the calculations.
This case is similar to the gas well described by Chierici.4 In that case, the reservoir pressure was 14,935 psia and the bottomhole temperature was 302° F. If one assumes that the pressure drop from the reservoir to the tubing is 500 psia, its bottomhole pressure is 14,435 psia.
Figs. 3 and 4 compare the calculated pressures and temperatures of the sample calculation with the pressure and temperatures measured by Chierici. These two figures and Table 3 show that the measured and calculated values are in reasonable agreement. F
References
- Smith, R.V., "Determining Friction Factors for Measuring Productivity of Gas Wells," AIME Petroleum Transactions, Vol. 189, 1950, pp. 73-82.
- Cullender, M.H., Smith, R.V., "Practical Solution of Gas-Flow Equations for Wells and Pipelines with Large Temperature Gradients," AIME Petroleum Transactions, Vol. 207, 1956, pp. 281-87.
- Messer, P.H., Raghavan, R., Ramey, H.J. Jr., "Calculation of Bottom-Hole Pressures for Deep, Hot, Sour Gas Wells," JPT, January 1974, pp. 85-92.
- Chierici, G.L., Sclocchi, G., and Terzi, L., "Pressure, temperature profiles are calculated for gas flow," OGJ, Jan. 7, 1980, pp. 65-72.
- Sagar, R.K., Doty, D.R., and Schmidt, Z., "Predicting Temperature Profiles in a Flowing Well," Paper No. SPE 19702, 64th SPE Annual Technical Conference and Exhibition, San Antonio, Oct. 8-11, 1989.
- Hason, A.R., and Kabir, C.S., "Aspects of Wellbore Heat Transfer During Two-Phase Flow," SPE Production & Facilities, August 1994, pp. 211-19.
- Chapra, S.C., and Canle, R.P., Numerical Methods for Engineers, Third Edition, McGraw-Hill, New York, 1998.
- Collier, J.G., and Thome, J.R., Convective Boiling and Condensation, Third Edition, Claredon Press, Oxford, UK, 1994.
- Taitel, Y., Bornea, D., and Dukler, A.E., "Modelling Flow Pattern Transitions for Steady Upward Gas-Liquid Flow in Vertical Tubes," AiChE Journal, Vol. 26, No. 3, 1980, pp. 345-54.
- Brill, J.P. and Beggs, H.D., "Two-Phase Flow in Pipes," Lecture Notes, Fourth Edition, 1982.
- Govier, G.W., and Aziz, K., The Flow of Complex Mixtures in Pipes, Van Nostrand Reinhold, New York, 1972.
- Peng., D.Y., and Robinson, D.B., "A New Two-Constant Equation of State," IEC Fundamentals, Vol. 15, No. 1, 1976, pp. 59-64.
- Mastanaiah, K., and Ganic, E.N., "Heat Transfer in Two-Component Dispersed Flow," ASME Transactions, Vol. 103, 1981, pp. 300-06.
- Incropera, F.P., and DeWitt, D.P., Fundamentals of Heat and Mass Transfer, Fourth Edition, John Wiley and Sons, New York, 1996.
- Willhite, G.P., "Over-all Heat Transfer Coefficients in Steam and Hot Water Injection Well, JPT, May 1967, pp. 607-15.
- Ramey, H.J., Jr., " Wellbore Heat Transmission," JPT, April 1962, pp. 427-35.
- Kharaka, Y.K., Callender, E., Carothers, W.W., "Geochemistry of Geopressured Geothermal Waters from the Texas Gulf Coast," Third Geopressured Geothermal Energy Conference, Lafayette, La.,1977.
The author
Cheng-Shen Fang is professor of chemical engineering at the University of Louisiana at Lafayette. He holds a BS from the National Taiwan University, Taipei, and MS and PhD degrees from the University of Houston.
