Radiation anomaly correlation helpful in Krishna-Godavari basin
This article presents the results of preliminary radiometric surveys carried out in a known hydrocarbon-bearing region in the Krishna-Godavari basin of eastern India. The area is studied to investigate the possible occurrence of radiometric anomalies associated with oil and gas deposits.
Using low energy gamma ray spectrometry, 315 soil samples were analyzed to determine uranium, thorium, and potassium content, and the data were statistically analyzed to estimate an anomaly parameter for each point of sampling.
This study indicated a striking correlation between total count and uranium distribution on one hand and hydrocarbon-bearing structures on the other. The results show that the productive zone is generally indicated by a radiometric low and barren zones represent highs in both total count and uranium anomaly maps.
The high anomalies in the periphery and the low anomalies in the center clearly outlined the oil and gas fields. Application of gamma ray spectrometric surveys appears to be an additional tool in evaluating the hydrocarbon potential in this region.
Introduction
Although the utility of the radioactivity method for detection of oil and gas deposits has not been fully established, such investigations were carried in the former USSR and limited studies have been undertaken in US and other countries.
A critical review of the present state of technology in this field indicates that this technique has potential application in oil exploration. A large number of cases have been reported where the presence of oil and gas deposits reflected in the radioactivity distribution on the surface.
Gamma radiation measurements by several investigators have indicated characteristic anomalies over petroleum deposits. Armstrong and Heemstra1 reviewed 273 papers and found that 85% reported some sort of a relation between gamma ray anomalies and hydrocarbon deposits.
Later studies also indicated low radioactivity over oil fields.2 3 Kilmer4 reported anomalously low total count gamma radiation over oil occurrences after normalizing the data for surface lithology. Negative values of normalized potassium and uranium were also observed over many oil fields.5 6 7
Bubsy et al.8 concluded that the gamma ray spectrometric method could not be applied diagnostically except in most drift-free geological environments.
The existence of radiometric anomalies over hydrocarbon deposits in many parts of the world indicated significant regularity, and the method is appearing to have potential application in oil exploration. With a view to evaluate the applicability of the gamma ray spectrometric method for hydrocarbon exploration in India, an experimental study was carried out to investigate the distribution of uranium, thorium, and potassium contents in soils in a part of known oil and gas fields of Krishna-Godavari basin.
Hydrocarbon potential
The Krishna-Godavari basin in Andhra Pradesh is one area of India that is prospective for oil and gas.
The present area of investigation forms a small part of the basin. Precambrian igneous and metamorphic rocks form the basement complex. These include gneisses, quartzite, and pegmatite. The basement follows an ENE-WSW to NE-SW trend following the dominant trend of Eastern Ghats.
The earliest sedimentary strata in this region belong to the Upper Cretaceous age, and alluvial sands of Pleistocene form the top of the sequence. Basaltic flows of Pleistocene age are found on ridge tops, basement highs, or near fault zones. Drapeover folds on the tilted blocks and down-to-basement faults provide the hydrocarbon trapping mechanism.
Oil & Natural Gas Corp. (ONGC) reported the occurrence of hydrocarbon structures within the region. Rao9 discussed the status of the hydrocarbons with emphasis on subsurface geological understanding of the basin.
The presence of hydrocarbons is associated with abnormally pressured Upper Cretaceous sands. The reservoir facies of the Eocene section is found to be oil and gas bearing, whereas the Miocene sections contain hydrocarbons due to their upward migration from a nearby Miocene source facies.
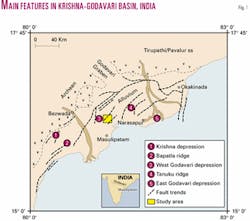
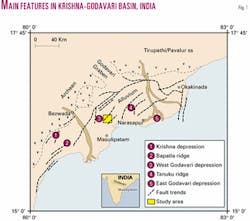
Based on the geological and geophysical surveys carried out by ONGC, Murthy and Ramakrishna10 identified three depressions, namely Krishna, West Godavari, and East Godavari, separated by two basement ridges, Bapatla and Tanuku. The region is marked by a number of anticlinal structures, which represent drapeover features or the Kaza ridge in the West Godavari depression, and is bordered by NE-SW to ENE-WSW trending faults (Fig. 1). Recent drilling data in some parts of the survey area indicate a basement depth of 2,000 m.
Patil11 conducted geochemical and magnetic surveys in the same area and observed anomalously low values of trace elements (Fe, Mn, Cr, Zn). He also reported that the magnetic susceptibility values of soil samples are below the background level over the oil and gas fields, indicating geochemically altered zones that resulted from the migration of the hydrocarbons.12 The available geological data indicate that oil might have accumulated in informal fold structures that resulted from a thrust system.
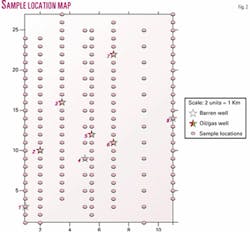
Out of eight wells ONGC drilled in the survey area, four (Nos. 2, 5, 6, and 7) are oil producing, one (No. 3) is gas producing, and the remaining (Nos. 1, 4, and 8) are barren.
Well 1, a large oil producer, and Well 7, a dry hole, were drilled and developed after this survey.
Radiometric surveys
Earlier airborne gamma ray spectrometric surveys in the Krishna-Godavari basin coupled with regional geological studies suggested possible association of low radiometric anomalies with hydrocarbon structures.13
In the present work, a possible occurrence of radiometric anomalies and their relation with hydrocarbon occurrences has been investigated by gamma ray spectrometric analysis of soil samples.
Several factors such as surface lithology, soil moisture content, vegetation shielding, counting geometry of instruments, etc., influence the radiometric data. Care has been taken to eliminate these nonpetroleum surface variations to obtain reliable radiometric data for determining their source at depth.
A total of 315 soil samples were collected at a rate of 2-3 samples/km along eight S-N traverses covering an area of about 72 sq km (Fig. 2). The first six traverses were sampled at two depths, 30 and 100 cm. Based on the results of the preliminary analysis, sampling was extended to two more traverses at a depth of 100 cm.
Soil samples were analyzed for uranium, thorium, and potassium concentrations using low energy gamma ray spectrometry.14 Energy windows centered at 0.35 MeV (214 Pb) for uranium, 0.24 MeV (212 Pb) for thorium, and 1.46 MeV (40 K) for potassium were measured as they provided higher sensitivity than the conventional energy lines.
Results, discussion
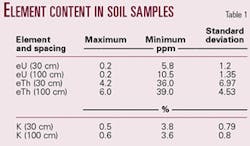
The distribution of radioelements in both the depth horizons 30 cm and 100 cm indicated similar pattern. The mean values and the ranges of eU, eTh, and K in soil samples are shown in the table.
In the case of uranium, relatively large variation is apparent in the range though the mean values are almost equal. In general, these values are close to the mean values of radioelements in soils over oil and gas deposits reported in the literature.15
The probability plot of eU, eTh, and K values showed that eU has bimodal distribution while eTh and K exhibit linear trends. This indicates that uranium probably has two modes of origin in soils, one due to the soil type and the other due to migration from below.
Although eU, eTh, and K have the same trend in both the soil horizons indicating that the soil formation is susceptible to retaining its radioelements, the profiles of 30 cm depth samples showed relatively larger fluctuations.
The data from 100 cm depth samples alone have been used for further analysis. With a view to identify possible anomalous zones, the observed data are standardized in terms of mean and standard deviation. For this purpose (Xi-M)/S.D. is calculated where Xi is the observed value for the sample, M is the mean for all the samples, and S.D. is the standard deviation.
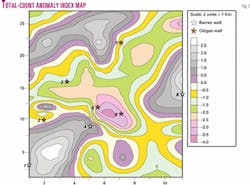
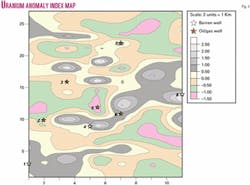
From these normalized values at every station, anomaly index contour maps were prepared (Figs. 3 and 4). Positive values of anomaly index, which indicate radioactivity higher than the mean, are considered as "highs" and negative values are treated as "lows."
While the zones of "highs" and "lows" are distributed all over the survey area, negative values of the total count gamma radiation are observed in the areas where all the five oil and gas producing wells are located (Fig. 3). In three distinct positive anomaly zones in total count anomaly index map at southwestern, eastern, and northwestern parts of the survey area, all three dry wells are located.
In the uranium anomaly index contour map (Fig. 4) three broad negative zones were observed in the northern, southeastern, and center parts of the survey area. Three oil and gas producing wells (wells 3, 5, and 6) are located in lensoid or annular ring-shaped negative zones at the center part of the area.
Interestingly, all three dry wells (wells 1, 4, and 8) are enclosed in the positive anomaly zones. The presence of a dry well (No. 4) near the oil producing wells 5 and 6, both in uranium and total count anomaly index maps, reflects the structural control in distribution of radioelements.
Both the total count and uranium anomaly index contour maps indicated a general high in the periphery and low in the center of the hydrocarbon reservoirs. While total count and uranium data indicated distinct closed "highs" and "lows," the distribution of thorium and potassium content in soils broadly outlined regional structural trends and was in general agreement with those depicted from magnetic anomalies.12
Findings
Whatever the formation mechanism of the radiation anomalies may be, there is a fair correlation between total count radioactivity and uranium distribution on one hand and the hydrocarbon bearing structures on the other.
There appears to be a correspondence between radiation anomalies and the oil and gas fields with all the five productive wells occurring in the "lows" and the three barren wells located in the "highs." As the entire basement is undulated and gently dipping towards the southeast, the escaping hydrocarbons probably control the radioactivity distribution in the soils.
As previous studies in this area suggested, the seepage of hydrocarbons that altered the geochemical environment in the soils probably controlled the distribution of the radioelements.
This preliminary study indicates that radioactivity, and in particular uranium anomalies, appear to be promising in providing additional information on the occurrence of hydrocarbons in this region. However, this needs to be investigated further by conducting detailed gamma spectrometric surveys over both productive and nonproductive areas and analyzing the data in combination with the established structural setup, groundwater conditions, and soil information together with the background of geochemical processes.
Such studies could establish the radiometry as a cost effective supplementary tool for oil exploration.
References
- Armstrong, F.E., and Heemstra, R.J., "Radiation halos and hydrocarbon reservoirs: A review," US Bureau of Mines Information Circular 8579, 1973.
- Weart, R.C., and Heimberg, G., "Exploration radiometrics, post survey drilling results," in Gottlieb, B.M., ed., "Unconventional methods in exploration for petroleum and natural gas III," Southern Methodist University Press, 1981, pp. 116-123.
- Curry, W.H., "Evaluation of surface gamma radiation surveys for petroleum exploration in the deep Powder River basin of Wyoming," in Davidson, M.J., and Gottlieb, B.M., eds., "Unconventional methods in exploration for petroleum and natural gas III," Southern Methodist University Press, 1984, pp. 25-39.
- Kilmer, C., "Developments in exploration radiometrics," OGJ, Vol. 16, 1986, pp. 124-131.
- Saunders, D.F., Terry, S.A., and Thompson, C.K., "Test of national uranium resources evaluation-gamma ray spectral data in petroleum reconnaissance," Geophysics, Vol. 52, 1987, pp. 1547-56.
- Saunders, D.F., Burton, K.R., Branch, J.F., and Thompson, C.K., "Relation of thorium normalized surface and aerial radiometric data to subsurface petroleum accumulations," Geophysics, Vol. 58, 1993, pp. 1,417-27.
- Saunders, D.F., Terry, S.A., and Thompson, C.K., "Tests of Australian aerial radiometric data for use in petroleum reconnaissance," Geophysics, Vol. 59, 1994, pp. 411-419.
- Bubsy, J.P., Peart, R.J., Green, C.A., Ogilvy, R.D., and Williamson, J.P., "A search for direct hydrocarbon indicators in the Formby area," Geophysical Prospecting, Vol. 29, 1991, pp. 691-710.
- Rao, G.N., "Geology and hydrocarbon prospects of east coast sedimentary basins of India with special reference to Krishna-Godavari basin," J. Geological Society of India, Vol. 41, 1993, pp. 444-454.
- Murthy, K.V.S., and Ramakrishna, M., "Structures and Tectonics of Godavari-Krishna coastal sedimentary basin," Bull. ONGC, Vol. 17, No. 1, 1980, pp. 146-158.
- Patil, S.K., "Integrated geophysical and geochemical surveys for hydrocarbons in Krishna-Godavari basi, Kaikalur area, AP, India," PhD thesis, Osmania University, India, 1992 (unpublished).
- Patil, S.K., Ramakrishna Rao, C.H., Poornachandra Rao, G.V.S., and Sitaramayya, S., "A study on short wavelength magnetic anomalies from the area of a hydrocarbon reservoir from a part of Krishna-Godavary basin, India," proceedings of the Seminar on Space Applications in Earth Systems, India Geophysical Union, 1993.
- Manglik, S.K., "Remote sensing for oil exploration in India," proceedings 30th annual convention, India Geophysical Union, 1993.
- Subjender Reddy, A., and Venkat Rao, N., "Determination of uranium, thorium and potassium contents in rock and soil samples using low energy gamma ray spectrometry," Terra Nova, Vol. 7, 1995, pp. 321-326.
- Alekseev, F.A., Gottokh, R.P., and Vorobyeva, "Regularities in the distribution of radioactive elements and natural gamma fields in oil and gas bearing regions," in Alekseev, F.A., ed., "Radiometry of oil and gas bearing regions," Nedra, Moscow, 1968 (in Russian).
The authors
A. Subjender Reddy ([email protected]) has worked as a geophysicist with the Dubai Municipality, United Arab Emirates, since 2000. He joined government service in India in 1992 and worked 8 years as a geophysicist in the groundwater department in Hyderabad. He has MSc Tech and PhD degrees, both from Osmania University, Hyderabad.
N. Venkat Rao ([email protected]) is professor of geophysics at Center of Exploration Geophysics, Osmania University, Hyderabad, India. For 32 years he has been involved in teaching and research in exploration geophysics. His research interests are radioactive and nuclear techniques.
