A steady-state analytical model describing the problem of gas condensation and resulting hydrodynamics in three-phase flow pipelines has been developed and proven by comparison to an operation of similar flow circumstances.
The model demonstrated that a point exists in pipeline where a maximum amount of liquid occurs and that this point is not fixed but strongly depends on the inlet gas-flow rates.
The model is an appropriate tool for engineering design of pipelines carrying gas and condensate, serving as both a predictive and a design tool.
The study that developed this model used continuity and momentum equations to calculate pressure drop and liquid holdup in three-phase flow pipelines.
Elevation changes
To transport natural gas, pipelines must often span great distances across undulating terrain in varying ambient temperature. When such pipelines operate in a single-phase gas flow regime, design calculations are readily available.
Liquid condensation in pipelines, however, commonly occurs because of the multicomponent nature of the transmitted natural gas and its associated phase behavior, as well as the inevitable temperature and pressure variations that occur along the pipeline.
Condensation causes the flow regime to change from single-phase to multiphase. The radical difference in engineering design required for this system, compared with that required dry-gas pipelines, makes the problem of significant interest to the gas industry.
Because the point and quantity of condensation is not usually known a priori, any attempt to develop a predictive capability for such a system must have an inherent means of providing this information. This requires a good coupling of the gas-phase behavior model with the appropriate analytical model.
Because most gas-condensate transmission pipelines in oil and gas fields have large diameters and operate at high pressures (high gas velocity and amount of liquid holdup being less than 10%), these lines cannot be modeled with current correlations.1 This lack is understandable because the database used in developing these correlations is usually limited and based on laboratory-scale experiments.
Another plausible source of their inadequacy is that most are based on the premise that flow is homogeneous. Thus, the correlations treat flow properties as representing a mixture rather than the individual phases.2 Gregory and Aziz,3 Fayed and Otten,4 and Cawkwell and Charles5 compared predictions of these models and found that they varied widely and did not match the measured data presented by Vincent and Adewumi.6
This investigation, after considering kinds of present flow regimes in gas-condensate transmission three-phase flow pipelines,7 used a fundamental analytical model developed from the basic laws of mass and momentum conservation. This model, coupled with a phase-behavior package, resulted in a compositional analytical model.
Assumptions
In the modeling of three-phase flow transmission pipelines (containing oil, water, and gas), six major assumptions have been made to formulate the analytical equations:
- Two immiscible liquid phases (oil and water) assumed are a single fluid with mixture properties.8
- The amount of liquid in the system is assumed to be small, and the gas flow rate gives a sufficiently high Reynolds number that the three-phase flow regime can be assumed to be annular-mist flow (most times) and stratified flow. Also, pressure gradient exists in the gas phase only.
- Flow is assumed to be steady state, one dimensional in the axial direction of the pipeline.
- The temperatures of gas and liquid phases are assumed to be equal at every point in the pipeline.
- The phase-behavior routine used in this multi-phase flow model implements a Peng and Robinson equation of state, modified by Shinta and Firoozabadi.9
- A unified physical model for prediction of flow pattern transition in the entire range of pipeline inclination is used.10
Analytical modeling
Because there are various flow regimes in gas-condensate three-phase flow pipelines, generally accepted analytical equations for stratified flow and annular flow regimes are used for modeling in this section.
- Stratified flow regime. In stratified flow, calculation of pressure drop is performed by writing a momentum balance for each phase, as shown in Equations 1-2 (see accompanying box).11 12 The required parameters in theses equations can be determined by Taitel.13
The amount of the liquid holdup in this flow regime is calculated with the Taitel and Dukler11 12 equations (Equations 4 and 5).
For determination of the liquid level (hL) and water level (hw), Equations 6 and 7 can be used by eliminating pressure drop from Equations 1-3.13
Equations 6 and 7 must be solved simultaneously to yield the liquid level and the water liquid level. The equations are not linear and can have multiple solutions. Taitel presents a method of solution that works quite well.13
- Annular flow regime. Liquid holdup of annular flow is calculated with a nonlinear equation suggested by Barnea,14 as shown in Equations 11 and 12.
Landman solved Equation 12 for a wide range of X and Y and obtained only one result in the range of (0, 1) in spite of Equations 6 and 7.15
The method of evaluating pressure drop in this flow regime is suggested by Baker16 as according to cause: friction or elevation.
Friction
For annular flow, it is supposed that the gas phase is continuous, and therefore pressure drop due to friction could be calculated conventionally with homogeneous flow assumption and using the correlations for single-phase flow such as Colebrook Equation17 with attention to the following assumptions:16
- The area of flow cross-section will decrease as a result of liquid holdup through slippage between gas and liquid phases.
- The shear-stress of the gas-liquid interface is increased because of the waves over the region.
- Average properties of gas and liquid phases are used.
See Equations 13 and 14.
The amount of (e/D)e in Equation 12 is calculated by determination of gas-liquid interface roughness (ej) and effective diameter of pipeline (De) as shown in Equation 15,14 where the effective diameter of pipelines is calculated according to the Baker16 relation shown in Equation 16.
Also, the roughness of interface (ej) is determined by the Duns and Ros correlation.18 This correlation, which is applicable to the mist upward flow in vertical pipelines, expresses that the roughness of interface as a multiplication of dimensionless Weber number and dimensionless viscosity number of liquid phase, as in Equations 17 and 18.
Note that in this flow regime, because gas flow is continuous phase and responsible for formation of any waves on the gas-liquid interface, the dimensionless Weber number is suggested in Equation 19.
To exert physical limitations, a maximum amount for ej is supposed, where if value of ej be more than hL/4, thus amount of ej is equal to hL/4.16
Elevation
For those parts of pipelines including upward inclinations or relatively horizontal flow, Baker16 assumed that both gas and liquid phases contribute in pressure gradient due to elevations (Equation 20).
Also for those parts of pipelines that have downward inclination, it is assumed that the continuous gas phase has the main role in pressure recovery and this recovered potential energy is consumed by the liquid phase in the form of heat and friction (Equation 21).
Because the changes of phase-velocity along pipelines are insignificant, the pressure gradient due to acceleration is assumed negligible; therefore, total pressure gradient of flow is the sum of pressure gradients due to friction and elevation.16
Model test
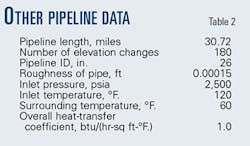
The present model was tested to perform a prediction on a gas-condensate transmission three-phase flow pipeline (30.72 mile, 26 in. OD) that traverses a hilly terrain with 180 elevation changes.
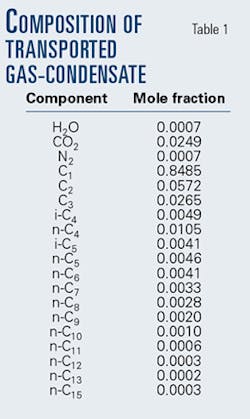
As Table 1 shows, the natural gas being transported has 19 components. The computational overhead for phase and flash calculation, however, was found to be excessive for this system.
Table 2 reports the pipeline data needed for all the runs.19
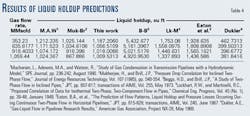
The results of the present model (for prediction of pressure drop and liquid holdup in gas-condensate transmission three-phase flow pipelines) were compared with the results of many popular models previously used to study this same gas transmission pipeline. Tables 3 and 4 show the results of different models at various specified inlet-gas feed rates.
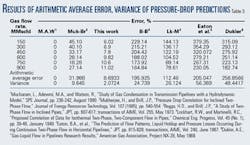
Also, results of arithmetic average error and variance of pressure drop and liquid holdup predicted with the those models, in comparison with the Mucharam model,19 appear in Tables 5 and 6. Note that the Mucharam model is the only fundamental hydrodynamic model developed from the basic laws of mass and momentum conservation as opposed to the several present empirical models that give erroneous results for design of gas-condensate transmission pipeline.20
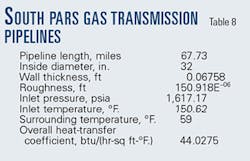
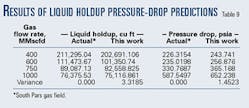
Also, Table 9 summarizes the main results of comparison between the steady-state simulation of South Pars gas transmission pipeline and existing pipeline. Notice that the gas produced from South Pars offshore platforms is transferred unprocessed to the receiving onshore facilities via two 67.7 mile, 32-in. OD multiphase sea lines.
Table 7 shows the composition of the transported natural gas; Table 8 reports the pipeline data needed for all the runs.
References
- Hart, J., and Hamersma P.J., "Correlations Prediction Frictional Pressure Drop and Liquid Holdup during Horizontal Gas-Liquid Pipe Flow with Small Liquid Holdup," Int. J. of Multiphase Flow, Vol. 15 (1989), pp. 974-464.
- Adewumi, M.A., and Mucharam, L., "Compositional Multiphase Hydrodynamic Modeling of Gas/Gas-Condensate Dispersed Flow in Gas Pipelines," SPE J., pp. 85-90, February 1990.
- Gregory, G.A., and Aziz, K., "Design of Pipelines for Multiphase (Gas-Condensate) Flow," J. Canadian Petroleum Technology, July-September 1975, pp. 28-33.
- Fayed, A.S., and Otten, L., "Comparing Measured and Calculated Multiphase Pressure Drop," OGJ, Aug. 22, 1983, p. 136.
- Cawkwell, M.G., and Charles, M.E., "Pressure, Temperature Predicted for Two-Phase Pipelines," OGJ, May 27, 1985, p. 101.
- Vincent, P.A., and Adewumi, M.A., "Engineering Design of Gas-Condensate Pipeline with a Compositional Hydrodynamic Model," SPE J., November 1990, pp. 381-386.
- Acikgoz, M., Franca, F., and Lahey Jr., R.T., "An Experimental Study of Three-Phase Flow Regimes," Int. J. Multiphase Flow, Vol. 18 (1992), No. 3, pp. 327-336.
- Tek, M.R., "Multiphase Flow of Water, Oil and Natural Gas through Vertical Flow Strings," Petrol. Technology (1961), pp. 1029-1036.
- Shinta, A.A., and Firoozabadi, A., "Predicting Phase Behavior of Water/ Reservoir-Crude Systems with the Association Concept," SPE J. (1997), pp. 131-137.
- Barnea, D., "A Unified Model for Prediction Flow Pattern-Transitions for the Whole Range of Pipe Inclinations," Int. J. Multiphase Flow, Vol. 13 (1987), pp. 1-12.
- Taitel, Y., and Dukler, A.E., "A Model for Prediction of Flow Regime Transition in Horizontal and Near Horizontal Gas-Liquid Flow," AICHE J, Vol. 22 (1976), pp. 47-55.
- Taitel, Y., and Dukler, A.E., "A Theoretical Approach to the Lockhart & Martinelli Correlation for Stratified Flow," Int. J. Multiphase Flow, Vol. 2 (1976), pp. 591-595.
- Taitel, Y., Barnea, D., and Brill, J.P., "Stratified Three-Phase Flow in Pipes," Int. J. Multiphase Flow, Vol. 7 (1995), pp. 53-60.
- Barnea, D., "Transition From Annular Flow and From Dispersed Bubble Flow-Unified Models for the Whole Range of Pipe Inclinations," Int. J. Multiphase Flow, Vol. 12 (1986), pp. 733-744.
- Landman, M.J., "Non-Unique Holdup and Pressure Drop in Two-Phase Stratified Inclined Pipe Flow," Int. J. Multiphase Flow, Vol. 17 (1991), pp. 377-394.
- Baker, A., Nielsen, K., and Gabb, A., "Pressure Loss, Liquid Holdup Calculation Developed," OGJ, Mar. 14, 1988, p. 55.
- Colebrook, C.F., "Turbulent Flow in Pipes with Particular Reference to the Transition Region between the Smooth and Rough Pipe Laws," Inst. Civil Engrs., Vol. 11 (1939), pp. 133-150.
- Duns Jr., H., and Ros, N.C.J., "Vertical Flow of Gas and Liquid Mixtures in Wells," proceedings, 6th World Petroleum Congress, Vol. 451 (1963).
- Mucharam, L., Adewmi, M.A., and Watson, R., "Study of Gas Condensation in Transmission Pipelines with a Hydrodynamic Model," SPE J., August 1990, pp. 236-242.
- Battara, V., Gentilini, M., and Giacchetta, G., "Condensate-Line Correlations For Calculating Holdup, Friction Compared to Field Data," OGJ, Dec. 30, 1985, p. 148.
The author
Saeid Mokhatab ([email protected]) is a research assistant in the chemical engineering department of Tehran University. He has also served as a research consultant in the design and fabrication of mixed chemical reactors at Tehran University (2000-01) and as a teaching assistant in the chemical engineering department (1998-2000). He has worked as a process engineer in South Pars gas field development project (2001-present) and a research consultant for BIPC, Iran (2001). Mokhatab holds a BSc (1998) in gas engineering from Tehran University and an MSc in chemical engineering (2000) from Tarbiat Modarres University, Iran.
