Spiking US natural gas prices in late 2000 and early 2001 surprised many gas processors; most had not hedged the cost side of their profit margins.
Those margins through 2001 hovered at or below breakeven levels for 9 of 12 months because natural gas prices declined relatively slowly on fears of another price spike during the 2001-02 winter heating season.
At the same time, the US economic recession and persistent weakness in ethylene feedstock demand pushed crude oil and NGL prices steadily lower after mid-year.
This article presents an evaluation of trends in natural gas and crude oil pricing and pricing volatility and the implications for gas processing profitability. This article also evaluates the emerging need for selective use of risk-management tools to improve profitability for gas plants.
Pricing volatility
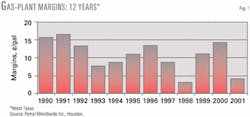
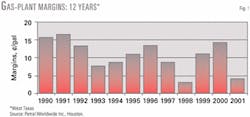
Profit margins for up to two-thirds of NGLs recovered by gas plants in the US depend on the difference between NGL prices and those for natural gas. The gross margin for a West Texas gas plant averaged 10.66¢/gal during 1990-2001. Gross margins ranged from a high of 16.4¢/gal in 1991 to a low of 2.9¢/gal in 1998.
Fig. 1 presents trends in gas-plant profit margins.
When gas-plant gross margins are stronger than 5¢/gal, most gas processors will make money. Conversely, when gas plant gross margins are weaker than 5¢/gal, most gas processors will lose money. Gas-plant gross margins were less than 5¢/gal only during 1998 and 2001.
Seasonal variations in crude oil demand and refined products prices create a natural fundamental basis for pricing volatility. Speculative traders in crude oil futures markets have a vested interest in pricing volatility. In any given year, crude oil prices will fluctuate within a range of $3-6/bbl. In some years, the trading range has been much wider.
Ethane, propane, and normal butane compete with crude oil-derived feedstocks such as naphtha and gasoil for incremental feedstock demand in the US Gulf Coast ethylene feedstock market. Ethylene producers tend to adjust their feedstock slates monthly to reduce ethylene production costs.
The economic competition between NGL feedstocks and crude oil-derived feedstocks is one of the strongest influences on NGL prices. As a result, NGL prices have a strong propensity to rise or fall as crude oil prices rise or fall.
NGL marketers and consumers frequently calculate the pricing ratio between NGLs and West Texas Intermediate crude oil to measure the weakness or strength of a particular product price. Price ratios vs. WTI vary significantly for ethane, propane, butane, and natural gasoline.
Gas processors recover and sell all NGLs, however, and the weight-average price of all NGLs determines the gas processors' gross revenue. Hence, the ratio of composite NGL prices vs. WTI gives an insight into the importance of crude oil price trends for NGL prices.
Petral Worldwide Inc., Houston, calculates the composite price by weighting the price of each product based on its average share of raw mix production.
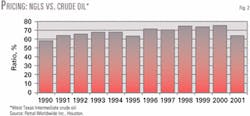
The ratio of the composite NGL price vs. WTI averaged 65.8% during 1991-95 and 73.3% during 1996-2000.
Fig. 2 shows trends in pricing ratio for composite NGL prices and WTI prices. This graph illustrates the strong influence that crude oil pricing trends have on composite NGL prices.
Trends
Natural gas prices are equally important in determining gas-processing profit margins. All raw natural gas production streams contain varying volumes of NGLs. Most natural gas production is processed to remove NGLs before the natural gas is injected into natural gas pipelines for sale to consumers.
Gas processors must compensate gas producers for the value of NGLs removed from raw natural gas streams. Plant-tailgate natural gas prices determine the cost basis for NGLs removed by gas processing operations. Hence, variations in natural gas prices determine variations in the cost basis for NGLs.
Pricing volatility is also a fact of life in natural gas prices.
Natural gas prices ranged from a low of $1.19/MMbtu in 1991 to a high of $3.47/MMbtu or the crude oil equivalent of $7.00-20.00/bbl.
From a practical perspective, peak natural gas prices seldom persisted for more than a month and were reasonably predictable within a range of $2.00-2.50/MMbtu during 1993-99.
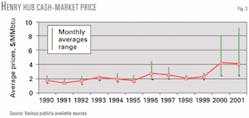
Gas processors had little reason to consider the use of natural gas risk-management tools during this 7-year period of relative price stability. Trends in Henry Hub (La.) natural gas prices appear in Fig. 3.
Price volatility in natural gas markets increased substantially after 1999, however. Natural gas prices ranged from a low of $2.37/MMbtu in January 2000 to a high of $9.13/MMbtu in January 2001 or the crude oil equivalent of $14-53/bbl. Also significant for gas processors, annual average natural gas prices were nearer the low end of the range than the high end throughout 1990-2001.
Natural gas markets experience very significant seasonal variation in total demand while natural gas production is much less seasonal.
Variations in natural gas prices tend to mirror the seasonal swings in natural gas demand.
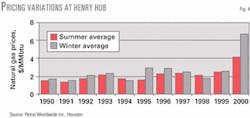
Natural gas prices were nearly always higher in winter than in summer during 1990-2001. The winter price premium averaged 24¢/MMbtu during 1990-99 or the crude oil equivalent of $1/bbl.
Seasonal variations in natural gas prices represented variations in the cost basis for gas processing of less than 10% of composite NGL prices during 1990-99.
The 8-week period of persistently cold weather in late 2000 sparked a price spike, and winter gas prices averaged $6.14/MMbtu higher than summer gas prices or the crude oil equivalent of nearly $15/bbl.
Seasonal variations in natural gas prices during 2000 were equal to 64% of the average composite NGL price in 2000. Seasonal variations in Henry Hub natural gas prices appear in Fig. 4.
Differentials
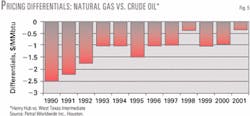
Crude oil prices strongly influence composite NGL prices, and natural gas prices determine the cost basis. When pricing differentials between crude oil and natural gas are wide, gas-processing profit margins will be strong.
Conversely, when pricing differentials between crude oil and natural gas are narrow, gas-processing profit margins will be weak.
Fig. 5 shows trends in natural gas-crude oil pricing differentials. As expected, years in which gas-processing margins were weak correspond with the years in which pricing differentials were unusually narrow.
The author
Dan Lippe is president of Petral Worldwide Inc., Houston. In 1974, he began an working for Diamond Shamrock Chemical Co. in a variety of technical and plant-management positions. He began his consulting career at Pace Consultants in 1979 and was employed by Resource Planning Consultants as a partner 1981-86. After that company's merger with Bonner & Moore, Lippe served as manager of NGL studies until 1988. He holds a BS in chemical engineering from Texas A&M University and an MBA from Houston Baptist University. He is a member of GPA and chaired its NGL Market Information Committee 1992-94 and 1996-2000.
