US OLEFINS: FIRST-HALF 2012—Heavy turnaround activity pushed ethylene production to 3-year low
Dan Lippe
Petral Consulting Co.
Houston
Microeconomic factors (downtime for turnarounds and trends in production costs from heavy feeds, for example) rather than macroeconomic trends during first-half 2012 were more important influences on short-term trends in US ethylene production and profitability, as was the case during second-half 2011.
"Big picture" questions certainly dominated headlines during first-half 2012. From financial and economic perspectives, European sovereign debt was the crisis du jour in 2011 and was again at center stage during first-half 2012.
Europe's problems with sovereign debt, however, had little direct impact on demand for primary petrochemicals in North America. The most important microeconomic consideration that influenced production, feedstock demand, and coproduct propylene supply was the decline in capacity in operation due to planned maintenance and turnarounds.
Feed slate trends
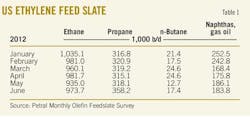
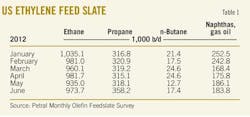
Petral Consulting Co.'s monthly survey results showed ethylene industry demand for fresh feed averaged 1.55 million b/d for first-quarter 2012 and declined to 1.49 million b/d in second-quarter 2012. Demand for fresh feed in first-quarter 2012 was 75,200 b/d (4.6%) less than in first-quarter 2011, and demand in second-quarter 2012 was 122,300 b/d (7.6%) less than in second-quarter 2011.
According to Petral's survey, demand for LPG feeds (ethane, propane, and normal butane) averaged 1.33 million b/d during first-quarter 2012 and declined to 1.31 million b/d in second-quarter 2012. Demand for LPG feed in first-quarter 2012 was 15,200 b/d (1.2%) higher than in first-quarter 2011. Demand for LPG feed in second-quarter 2012 was only 17,100 b/d (1.3%) less than in second-quarter 2011.
Finally, LPG feeds accounted for 86% of fresh feed in first-quarter 2012 and 88% in the second-quarter 2012. LPG feeds' share of total fresh feed in second-quarter 2012 was a record high. For 2005-07, LPG feeds accounted for 70% total fresh feed.
Economics for LPG feeds vs. heavy feeds remained consistently favorable during first-half 2012 as has been true for ethane since 2007 and for propane (consistently) since 2009. As expected, ethylene producers further increased their use of ethane and further reduced their use of heavy feeds. Ethane's share of total fresh feed was 64% during first and second quarters 2012 vs. 62% in second-half 2011.
Turnaround activity resulted in a decline in operating rates for multifeed plants during first-half 2012. Based on Petral's survey, 5-7 billion lb/year of multifeed plant capacity (16% of total multifeed capacity) was out of service for maintenance March through June. In first-quarter 2012, operating rates were 81% vs. 85% in fourth-quarter 2011. In second-quarter 2012, operating rates dipped to 80%.
Finally, ethane accounted for 53% of fresh feed for multifeed plants during first-quarter 2012 and increased to 55% in second-quarter 2012 vs. 46% during first and second-quarter 2011 (Table 1).
Statistics published by the US Bureau of Economic Analysis showed real gross domestic product (GDP) growth for first-quarter 2012 was 2%, compared with first-quarter 2011. Preliminary estimates for first quarter showed growth slowed to 1.5% but was consistent with growth during second-half 2011.
Statistics published by Foreign Trade Division of the US Bureau of Census, however, showed exports of high-density polyethylene were 13.5% less than in the first 5 months of 2011. The decline in polyethylene exports helped to offset the decline in ethylene production.
Petral forecasts US ethylene plants will operate at 85-88% of nameplate capacity during second-half 2012. Demand for fresh feed will average 1.53-1.58 million b/d during third and fourth quarters 2012. Based on this forecast, demand for LPG feeds will average 1.35-1.38 million b/d during third and fourth quarters 2012.
Fig. 1 presents historic trends in ethylene feed.
US ethylene production
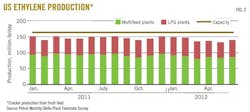
Petral's survey showed ethylene production from olefin plants averaged 141.7 million lb/day during first-quarter 2012 and declined to 135.8 million lb/day during second-quarter 2012. Ethylene production in first-quarter 2012 was 395 million lb (3.0%) less than in first-quarter 2011; production in second-quarter 2012 was 875 million lb (6.6%) less than in second-quarter 2011.
Survey results showed downtime for turnarounds (a microeconomic factor) averaged 4.2 billion lb/year (7.0%) of industry nameplate capacity during first-quarter 2012 and 8.5 billion lb/year (14.2%) during third-quarter 2011. This microeconomic factor was the primary reason for the decline in ethylene production but it also contributed to strong pricing and profitability in first and second quarters 2012.
Feedstock prices, coproduct values, and ethylene plant yields determine ethylene production costs. Petral maintains direct contact with the olefin industry and tracks historic trends in spot prices for ethylene and propylene. We use a variety of sources to track trends in feedstock prices. Some ethylene plants have the necessary process units to convert all coproducts to purity streams. Some ethylene plants, however, do not have the capability to upgrade mixed or crude streams of various coproducts and sell some or all their coproducts at discounted prices. Petral evaluates ethylene production costs in this article based on all coproducts valued at spot prices. |
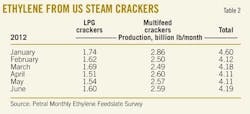
Petral's survey shows ethylene production from LPG plants averaged 56.2 million lb/day for first-quarter 2012 but declined in second quarter, averaging 50.7 million lb/day. Production from LPG plants in first-quarter 2012 was 150 million lb (3.1%) more than in first-quarter 2011. Production for second-quarter 2012 was 115 million lb (1.3%) less than in second-quarter 2011.
Ethylene production from multifeed plants averaged 87.2 million lb/day for first-quarter 2012 and declined to 85.1 million lb/day for second quarter. Production from multifeed plants during first-quarter 2012 was 545 million pounds (6.5%) less than during first-quarter 2011. Production in second-quarter 2012 was 760 million lb (8.9%) less than during second-quarter 2011 (Table 2).
As long as variable production costs based on ethane and propane remain less than costs based on light naphtha and other heavy feeds, ethylene producers will continue to operate LPG plants at full capacity during third and fourth quarters 2012 and will operate multifeed plants at lower rates to balance the market.
Fig. 2 presents trends in ethylene production.
US propylene production
Coproduct propylene supply depends primarily on the use of propane, normal butane, naphtha, and gas oil feedstocks. Petral's survey for first-quarter 2012 shows ethylene producers used 319,000 b/d of propane, 21,000 b/d of normal butane, and 221,000 b/d of heavy feeds. Survey results for second-quarter show demand for propane increased to 330,100 b/d, demand for normal butane declined to 15,600 b/d, and demand for heavy feeds declined to 185,100 b/d.
Total demand in first-quarter 2012 was 561,000 b/d, 107,800 b/d (16.1%) less than in first-quarter 2011. Total demand for these feeds in second-quarter 2012 was 530,800 b/d, 153,700 b/d (22.5%) less than in second-quarter 2011.
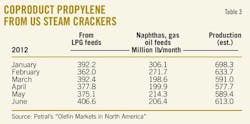
Coproduct supply (based on estimates derived from Petral's feedstock survey) declined in first and second quarters 2012. Production averaged 21.4 million lb/day in first-quarter 2012 and 19.7 million lb/day in second-quarter 2012.
Coproduct supply for first-quarter 2012 was 361.5 million lb (15.8%) less than in first-quarter 2011. Coproduct supply for second-quarter 2012 was 496.0 million lb (19.5%) less in second-quarter 2011.
Propylene production from LPG feeds averaged 12.8 million lb/day in first-quarter 2012 and 12.7 million lb/day in second quarter. Production from LPG feeds in first-quarter 2012 was 65.4 million lb (5.4%) less than in first-quarter 2011. Production from LPG feeds in second-quarter 2012 was 137.2 million lb (10.6%) less than in second-quarter 2011.
The key factor was the decline in normal butane demand. In first-quarter 2012, demand was 41,000 b/d less than in first-quarter 2011. Furthermore, and contrary to typical seasonal patterns, demand for normal butane in second-quarter 2012 was 55,300 b/d less than in second-quarter 2011.
Propylene production from heavy feeds declined in first and second quarters 2012. Coproduct propylene from heavy feeds averaged 8.7 million lb/ in first-quarter 2012 and 6.9 million lb/day in second-quarter 2012. Production from heavy feeds in first-quarter 2012 was 296 million lb (27.6%) less than in first-quarter 2011. Production from heavy feeds in second-quarter 2012 was 358.8 million lb (36.3%) less than in second-quarter 2011 (Table 3).
PDH plant, refineries
PetroLogistics's propane dehydrogenation plant in the Houston Ship Channel produced an estimated 2.7-2.8 million lb/day of propylene during first and second quarters 2012. At full capacity operations, Petral estimates production will average 3 million lb/day.
Refinery propylene sales into the merchant market are a function of fluid catalytic cracking unit (FCCU) feed rates, FCCU operating severity, and economic incentives to sell propylene rather than use it as alkylate feed. The seasonal variation in FCCU feed rates is the most important parameter causing swings in refinery propylene sales. Economic factors are generally of secondary importance.
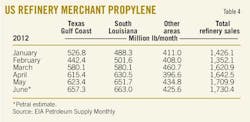
Statistics from the US Energy Information Administration indicate FCCU feed rates averaged 4.56 million b/d in first-quarter 2012 and were an estimated 5.0 million b/d in second-quarter 2012. FCCU feed rates in first-quarter 2012 were 175,700 b/d less than in first-quarter 2011; feed rates in second-quarter 2012 were unchanged vs. second-quarter 2011. FCCU feed averaged 31.5% of crude runs in first-quarter 2012 and about 33.3% of crude runs in second-quarter 2012.
EIA statistics show that refinery-grade propylene production averaged 48.3 million lb/day in first-quarter 2012 and 55.9 million lb/day in second-quarter 2012. Production in first-quarter 2012 was 71 million lb (1.6%) less than in first-quarter 2011. Production in second-quarter 2012 was 401 million lb (8.6%) more than in second-quarter 2011 (Table 4).
US propylene production
EIA's statistics for refinery-grade propylene and Petral's estimates for coproduct supply show that total US propylene supply declined in first-quarter 2012, averaging 69.5 million lb/day. Production was 6.5 million lb/day (8.5%) less than in first-quarter 2011. US propylene supply in second-quarter 2012 increased, averaging 75.5 million lb/day. However, production was 2.4 million lb/day (3.1%) less than in second-quarter 2011.
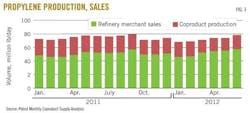
Fig. 3 shows trends in coproduct and refinery merchant propylene sales (as reported by EIA).
Ethylene economics, pricing
Production costs for ethylene in the Houston Ship Channel (assuming full spot prices for all coproducts) based on purity-ethane feeds averaged 19¢/lb in first-quarter 2012. Production costs based on ethane for first-quarter 2012 were 13¢/lb less than in fourth-quarter 2011 and were 5¢/lb lower than year-earlier costs. In first-quarter 2012, purity ethane provided ethylene producers with cost savings of 28¢/lb vs. natural gasoline.
Production costs based on purity ethane declined to 13¢/lb in second-quarter 2012 and were 6¢/lb lower than in first-quarter 2012 and 14¢/lb lower than in second-quarter 2011. Purity ethane provided producers with a cost savings of 24¢/lb vs. natural gasoline in second-quarter 2012.
Production costs for purity propane averaged 24¢/lb in first-quarter 2012; costs based on propane were 17¢/lb less than in fourth-quarter 2011 and 8¢/lb less than in second-quarter 2011. Production costs declined to 12¢/lb in second-quarter 2012 and were 12¢/lb lower than in first-quarter 2012 and 14¢/lb lower than in second-quarter 2011.
Variable production costs for propane were 5¢/lb higher than ethane for first-quarter 2012 but were even with ethane in second-quarter 2012. Propane provided ethylene producers with cost savings of 23¢/lb relative to natural gasoline in first-quarter 2012 and 24¢/lb in second-quarter 2012.
Production costs for natural gasoline averaged 46¢/lb for first-quarter 2012 but dropped to 36¢/lb in second-quarter 2012. Production costs for natural gasoline were 5¢/lb lower than in fourth-quarter 2011 but were 5¢/lb higher than in first-quarter 2011. Production costs in second quarter were 2¢/lb less than in second-quarter 2011 (Table 5).
Ethylene pricing, profit margins
For first-quarter 2012, spot prices for ethylene averaged 64.5¢/lb, 14¢/lb higher than the average for fourth-quarter 2011, according to PetroChem Wire (www.petrochemwire.com). The contract benchmark was 55.2¢/lb for first-quarter 2012 and 0.6¢/lb higher than in fourth-quarter 2011.
Spot prices for ethylene declined during second-quarter 2012, averaging 55.6¢/lb, or 9¢/lb lower than the average for first-quarter 2012. The contract benchmark also weakened, averaging 46.8¢/lb in second-quarter 2012.
Spot prices for ethylene are normally discounted vs. nominal contract prices, but extensive downtime for turnarounds (the primary microeconomic factor) during February through June sparked a surge in spot prices during first-quarter 2012. Spot prices were 4¢/lb premium vs. contract benchmark pricing in January. Premiums surged to 12-14¢/lb during February through April.
Downtime for turnarounds was at its peak of 10 billion lb/year (annualized) in April but dropped to 9 billion lb/year in May and 7 billion lb/year in June. As ethylene production rates recovered, premiums for spot prices weakened to 9¢/lb in May and slipped to a discount of 3¢/lb in June.
Margins based on the contract benchmark prices were stronger across the board for all major feedstocks in first-quarter 2012 than in fourth-quarter 2011. Margins based for purity ethane were 32¢/lb in January and increased to 38-39¢/lb in February and March. Margins based on purity ethane averaged 36.4¢/lb for first-quarter 2012 and were 13.5¢/lb higher than in fourth-quarter 2011.
Margins based on propane were 24¢/lb in January and improved to 34-36¢/lb in February and March. Margins based on propane averaged 32¢/lb in first-quarter 2012 and were 17¢/lb stronger than in fourth-quarter 2011. Margins based on purity propane were 35¢/lb in second-quarter 2012.
Finally, margins based on natural gasoline feeds were 9¢/lb in first-quarter 2012 and improved to 11¢/lb in second-quarter 2012. Margins in first-quarter 2012 were 6¢/lb stronger than in fourth-quarter 2012.
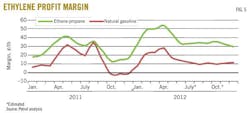
Fig. 4 shows historic trends in ethylene prices (spot prices and net transaction prices). Fig. 5 shows profit margins based on spot ethylene prices and variable production costs.
Refinery, polymer-grade propylene pricing
The growing inventory surplus had a strong bearish influence on spot prices during fourth-quarter 2011, and spot prices for refinery-grade propylene fell to a low of 38-39¢/lb in December 2011. Spot prices for refinery-grade propylene, however, nearly doubled during first-quarter 2012. Spot prices jumped to 50-51¢/lb in January and were 68-70¢/lb in March. Prices averaged 61.6¢/lb in first-quarter 2012.
During first-quarter 2012, however, EIA statistics showed refinery-grade propylene supply declined by 216 million lb and inventory fell 211 million lb. These were the key factors that supported the robust recovery in spot prices during first-quarter 2012.
EIA weekly inventory reports show refinery-grade propylene inventory continued to decline during April and May 2012 but rebounded to about 0.75 billion lb at the end of June. Inventory at that point was unchanged vs. the end of April.
At the same time, refinery-grade propylene merchant sales increased by 600-700 million lb during second-quarter 2012. These trends reversed the bullish trend of first-quarter 2012, and spot prices for refinery-grade propylene dropped 18¢/lb in May and 12.5¢/lb in June. Prices were again 36-37¢/lb during June, slightly lower compared with depressed levels of December 2011.
The premium for refinery-grade propylene prices vs. unleaded regular gasoline prices averaged 12.9¢/lb for first-quarter 2012 vs. 1.7¢/lb for fourth-quarter 2011. As refinery-grade propylene supply increased in second-quarter 2012, premiums vs. unleaded regular gasoline prices weakened and averaged 4.8¢/lb.
During second-quarter 2012, premiums were 16¢/lb in April but narrowed to 3.4¢/lb in May. In June, spot prices for refinery-grade propylene were 5.1¢/lb less than unleaded regular gasoline prices.
During first-quarter 2012, the contract benchmark for polymer-grade propylene averaged 68.7¢/lb and was 9.3¢/lb more than the average for fourth-quarter 2011. The contract benchmark for polymer-grade propylene jumped to 72.5¢/lb in February (16.5¢/lb more than in January) and increased to 77.5¢/lb in March.
The decline in spot prices for refinery-grade propylene during May and June had a predictably bearish impact on the contract benchmark for polymer-grade propylene. The average contract benchmark fell 10¢/lb in May and 17¢/lb in June, averaging 65.2¢/lb for second-quarter 2012.
Premiums for polymer-grade propylene contract benchmark prices vs. spot refinery-grade propylene prices widened gradually during first-quarter 2012. The premium was 5.6¢/lb in January and widened to 6.7¢/lb in February and 8.9¢/lb in March. The premium for contract benchmark prices surged to 17.4¢/lb in May but narrowed to 12.8¢/lb in June and averaged 13.2¢/lb for second-quarter 2012.
Second-half 2012 outlook
Trends in global crude oil prices were bullish during January and February and dated Brent prices rallied to $125.38/bbl in March ($17.55/bbl higher than in December 2011) as Iran threatened to block the Strait of Hormuz. During mid-March through late June, however, prices for dated Brent and other international benchmark crudes declined $30-35/bbl.
The Norwegian oil workers' strike began in late June and curtailed 200,000-240,000 b/d of crude oil production in the Norwegian sector of the North Sea during the first 10 days of July. Oil prices rallied by $13-15/bbl during this period but remained well below levels of late February and early March.
In the Middle East, July was an important month because the United Arab Emirates commenced operating a new pipeline that enabled shipments of oil exports to ports outside the Strait of Hormuz. Iraq petitioned Saudi Arabia to end its ban on Iraqi oil exports to the Red Sea via the Iraq Pipeline through Saudi Arabia (IPSA). These developments will reduce the bullish influence of any future Iranian threats to block the Strait of Hormuz.
While bullish influences are on the wane, Europe's sovereign debt problems will continue to undermine confidence in its outlook for economic growth during second-half 2012. US economic indicators are a mixed bag with housing starts and automobile sales stronger. European problems and a measurable slowdown in Asia point to weaker GDP growth in the second half.
Crude oil buyers in Europe and the US East Coast will continue to buy alternatives to North Sea cargoes that were not loaded during the Norwegian oil workers' strike, but there will be little bullish impact after mid to late August.
The continued decline in Iranian oil production and exports (resulting from the EU embargo) is the primary bullish consideration and will provide support for prices during third-quarter 2012, but sluggish economic growth will undermine bullish considerations during fourth-quarter 2012. Petral forecasts dated Brent prices to average $100-110/bbl during third-quarter 2012 and $90-105/bbl during fourth quarter.
Despite the rally in crude oil prices in first-quarter 2012, spot prices for purity ethane in Mont Belvieu declined by 29¢/gal (34%) due to the very bearish impact of the extensive ethylene plant turnarounds and reduced ethylene production rates. Spot prices for purity ethane averaged 85.5¢/gal in fourth-quarter 2011 but were 56.4¢/gal in first-quarter 2012. Most of the decline in prices occurred during January and February.
Similarly, spot prices for propane declined by 18.1¢/gal (12.6%) in first-quarter 2012 vs. fourth-quarter 2011. Since ethane and propane are the two most important feedstocks for US ethylene producers, pricing weakness in one generally contributes to pricing weakness in the other.
Very mild winter weather November 2011 through March 2012 depressed propane demand in retail markets and resulted in an inventory surplus of 20 million bbl. A heavy turnaround season for ethylene plants in the Gulf Coast reduced feedstock demand for ethane for 5 consecutive months and resulted in an inventory surplus of 10-12 million bbl.
In most market circumstances, one feedstock will be in surplus and the other will be balanced or tight. In the current situation, ethane and propane supplies were both in surplus simultaneously during first-quarter 2012—a rare confluence of bearish circumstances.
The result was further weakness in spot prices for purity ethane and propane in Mont Belvieu during second-quarter 2012. Spot prices for ethane declined by 15.9¢/gal (28.3%) and spot prices for propane by 28.5¢/gal (22.6%).
Until inventory surpluses decline, surplus supplies of both major feedstocks will remain bearish influences on prices. Propane inventory surpluses will begin to ease during fourth-quarter 2012 if winter weather is nearer to the 5-year average and colder than in fourth-quarter 2011.
At the same time, ethane-recovery margins for some gas processors were weak enough to trigger ethane rejection during May and June. The decline in gas plant ethane production during third and fourth quarters 2012 and the likely increase in feedstock demand will begin to reduce ethane inventory levels. As inventories swing from surplus to balance, feedstock prices will rebound.
Petral forecasts variable ethylene production costs based on ethane will be steady during third and fourth quarters 2012 vs. third-quarter 2012 and will average 10-12¢/lb. Variable production costs based on propane will increase 2-3¢/lb in third-quarter 2012 due to steady or moderately stronger prices and weaker coproduct credits. Petral forecasts variable production costs based on propane will decline in fourth-quarter 2012 based on a strong rebound in coproduct credits with only moderately stronger propane prices.
Variable production costs for light naphtha have been an important consideration for spot ethylene prices since 2008, but gas oil became the high cost feedstock during second-quarter 2012. Variations in production costs are a very important consideration in ethylene price determination in the spot market. Petral forecasts gas oil will be the high-cost feedstock in third and fourth quarters 2012. Spot prices for high-sulfur distillate fuel oil are the basis for gas oil production costs.
Petral forecasts variable production costs based on gas oil will average 45-50¢/lb in third-quarter 2012. As spot prices for coproducts (especially propylene and butadiene) rebound and gas oil prices move lower with the forecast decline in crude oil prices, variable production costs based on gas oil will weaken and average 40-45¢/lb in fourth-quarter 2012.
Based on variable costs plus fixed cash costs for gas oil and natural gasoline, spot ethylene prices will average 45-48¢/lb during August through October but prices will slip to 40-44¢/lb in November and December. Petral forecasts the net transaction price will average 46-48¢/lb in third-quarter 2012 and 42-46¢/lb in fourth-quarter 2012. Net transaction prices will average 1-3¢/lb below spot prices in third-quarter 2012 but will be near parity in fourth-quarter 2012.
Prices for refinery-grade propylene fell 5¢/lb below parity vs. unleaded regular gasoline prices (on a ¢/lb basis) in June, and the discount widened to about 8¢/lb in July. Petral forecasts prices for refinery-grade propylene will remain discounted vs. unleaded regular gasoline prices through October, but the seasonal decline in refinery-grade propylene sales will spark a recovery in November and December. Prices will increase to 43-45¢/lb in fourth-quarter 2012 vs. 36-38¢/lb in third-quarter 2012.
The weakness in spot prices for refinery-grade propylene was one of the primary reasons for the drop in the contract benchmark price in June, but the contract benchmark recovered 1.5¢/lb in July.
Although contract benchmark prices for polymer-grade propylene declined in second-quarter 2012, the decline was modest compared with the collapse in refinery-grade propylene prices. Petral forecasts the decline in coproduct production in second-quarter 2012 will provide ongoing support for contract benchmark prices through September.
Polymer-grade propylene will average 51-55¢/lb in third-quarter 2012 and will increase to 54-60¢/lb during fourth-quarter 2012. Forecasts for polymer-grade propylene are based on premiums of 12-14¢/lb vs. refinery-grade propylene in third-quarter 2012 and 9-12¢/lb in fourth-quarter 2012.
The author
Daniel L. Lippe ([email protected]) is president of Petral Consulting Co. and Petral Worldwide Inc., Houston. He founded Petral Consulting in 1988 and cofounded Petral Worldwide in 1993 with Jim Cutler. He has expertise in economic analysis of petroleum products, including crude oil and refined products, natural gas, NGLs, other ethylene feedstocks, and primary petrochemicals. Lippe began his professional career in 1974 with Diamond Shamrock Chemical Co., moved into professional consulting in 1979, and has served petroleum, midstream, and petrochemical industry clients since. He holds a BS (1974) in chemical engineering from Texas A&M University and an MBA (1981) from Houston Baptist University. He is an active member of the Gas Processors Association and serves on its NGL Market Information Committee.
